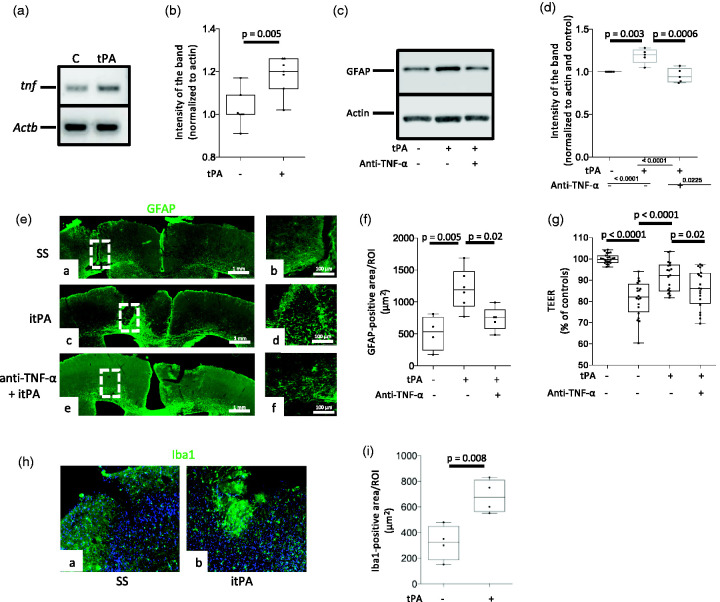
Figure 4.
TNF-α mediates tPA-induced astrocytic activation. A & B. Representative PCR analysis (a) and mean expression of tnf and Actb mRNA (b) in astrocytes incubated during 3 hours with 5 nM of tPA or vehicle (C: control). n = 7 per experimental group. Statistical analysis: two-tailed student’s t-test. C & D. Representative Western blot analysis (c) and quantification of the intensity of the band (d) of GFAP abundance in astrocytes treated during three hours with vehicle (control) or 5 nM of tPA, alone or in the presence of 40 ng/ml of anti-TNF-α blocking antibodies. n = 5 per experimental group. Statistical analysis: one-way ANOVA with Tukey’s multiple comparisons test. (e). Representative micrographs at 10X magnification of GFAP expression (green) in the frontal cortex of wild-type mice 24 hours after the intracerebral injection of 2 μl of either saline solution (SS; panels a & d), or a 5 nM solution of proteolytically inactive tPA (itPA; panels b & e), or a combination of itPA and 600 ng of anti-TNF-α blocking antibodies (panels c & f). Panels d, e, and f are 5X magnifications of the areas depicted by the dashed squares in panels a, b and c. (f) GFAP-positive area in regions of interest (ROI) drawn over the frontal cortex of animals exposed to the experimental conditions described in E. n = 4 (SS), 6 (itPA) and 5 (itPA + anti-TNF-α blocking antibodies). Statistical analysis: one-way ANOVA with Holm-Sidak’s multiple comparison’s test. (g) TEER of the in vitro model of the blood-brain barrier (BBB) assembled by brain microvascular endothelial cells and astrocytes co-cultured on both sides of a 1 μm pore size insert and pretreated with either 5 nM of tPA (n = 19 inserts assembled with cells from 4 cultures), or vehicle (control; n = 20 inserts assembled with cells from 3 different cultures), or a combination of tPA and 40 ng/ml of anti-TNF-α blocking antibodies (n = 20 inserts assembled with cells from 4 different cultures), 3 hours before exposure to 60 minutes of OGD conditions. Data are presented in relation to the TEER of inserts maintained under normoxic conditions (n = 24 inserts assembled with cells from 3 different cultures). Statistical analysis: one-way ANOVA with Tukey’s multiple comparisons test. (h) Representative micrographs at 20X magnification of Iba1 expression (green) in the frontal cortex of wild-type mice 24 hours after the intracerebral injection of 2 μl of either saline solution (SS; panel a) or a 5 nM solution of proteolytically inactive tPA (itPA; panels b). (i) Iba1-immunoreactive area in regions of interest (ROI) drawn over the frontal cortex of animals exposed to the experimental conditions described in H. n = 4 animals per experimental group. Statistical analysis: student’s t-test test.

