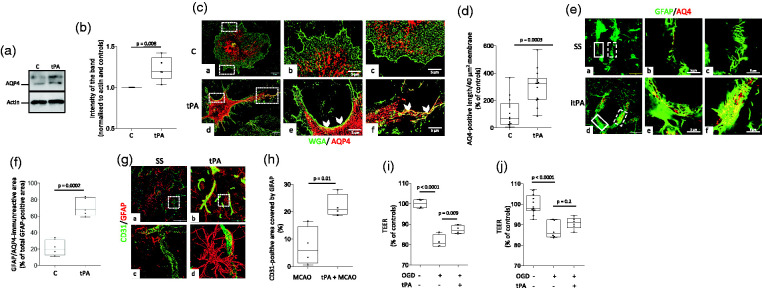
Figure 5.
Preconditioning with tPA increases the abundance of activated astrocytes and aquaporin-4-immunoreactive astrocytic end-feet processes in the neurovascular unit. A & B. Representative Western blot analysis (a) and quantification of the intensity of the band (b) of aquaporin-4 (AQ4) abundance in astrocytes incubated for three hours with vehicle (control) or 5 nM of tPA. n = 5 per experimental group. Statistical analysis: two-tailed student’s t-test. C. Representative confocal micrographs at 60X magnification of cerebral cortical astrocytes immunostained with the membrane marker Wheat Germ Agglutinin-Alexa Fluor 488 Conjugate (WGA; green) and anti-aquaporin-4 antibodies (AQP4; red) 3 hours after treatment with vehicle (control: C; panels a - c) or 5 nM of tPA (tPA; panels d - f). Panels b & c and e & f correspond to a 5X magnification of the area depicted by the white squares in a & b, respectively. Arrowheads in panels e & f show areas of the plasma membrane immunoreactive to anti-AQP4 antibodies in tPA-treated astrocytes. (d) Quantification of AQP4 immunoreactivity in end-feet processes of astrocytes exposed to the experimental conditions described in C. Values are given as percentage of control-treated cells. n = 14 cells from three different cultures per experimental group. Statistical analysis: two-tailed student’s t-test. (e & f) Representative confocal micrographs at 60 X magnification (a & d) of GFAP (green) and AQP4 (red) immunoreactivity in blood vessels of the frontal cortex of male C57BL/6J mice 24 hours after the intracerebral injection of 2 μl of either saline solution (SS; panel a), or a 5 nM solution of proteolytically inactive itPA (itPA; panel d). Panels b & c and d & f correspond to magnifications of the areas depicted by the continuous (b & e) and dashed (c & f) squares in a and d, respectively. F. Percentage of the total GFAP-immunoreactive area in the blood vessel wall that co-localizes with AQP4. n = 5 brains per experimental condition. Each dot represents the average of 6 micrographs per brain. Statistical analysis: two-tailed student’s t-test. (g) Representative three-dimensional reconstruction of confocal micrographs taken from the area surrounding the necrotic core of male C57BL/6J mice 24 hours after 60 minutes of tMCAO. Three hours before tMCAO animals were intravenously treated with either saline solution (a & c) or tPA (b & d). Green: CD31; red: GFAP. Magnification: 60X in a & b. Panels c & d correspond to a 400 X magnification of the area depicted by the dashed squares in a & b. (h) Quantification of the area immunoreactive to CD31 and GFAP in blood vessels in the zone surrounding the necrotic core of animals subjected to the experimental conditions described in G. n = 4 animals per experimental group, 6 micrographs per animal. Statistical analysis: two-tailed student’s t-test. (i & j) The in vitro model of the blood-brain barrier (BBB) assembled with brain microvascular endothelial cells cultured on the upper side of a 1 μm pore size insert and astrocytes plated either on the underside of the insert (i), or in the bottom of the lower chamber (j), were preconditioned with 5 nM of tPA (n = 4 in G and 6 in H) or vehicle (control; n = 4 in G and 6 in H), followed 3 hours later by exposure to 60 minutes of OGD conditions. The transendothelial electrical resistance (TEER) was quantified immediately after OGD and compared with the TEER of inserts maintained under normoxic conditions (n = 4 in G and 12 in H). Statistical analysis: one-way ANOVA with Tukey’s multiple comparisons test.

