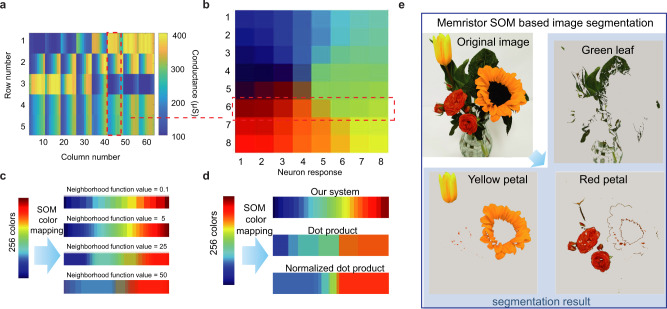
Fig. 2. Memristor-based SOMs for color mapping.
a The conductance map of the 5 × 64 memristor array after the training process. The weights in the 1st to 3rd row are Wdata, representing the R, G, B components of the output nodes, while the weights in 4th to 5th are the Wsquared. b The self-organized topology pattern of the trained color mapping SOM. Each pattern is represented as the output neuron response. The chosen eight weight vectors in the memristor array (in the red box of a) represents the weights of the nodes in the 6th row of 2D SOM. The color of the output nodes in the 6th row of 2D SOM (red box in b) can be defined by the R, G, B components in the of weight vectors in the memristor array (red box of a). c Effect of the neighborhood function factor (from 0.1 to 50) on the mapping of 256 colors. The number of mapped colors is increased at first and then decreased with the increasing of the neighborhood function factor. d Comparison of our SOM, dot product, and normalized dot product methods to calculate similarities for color mapping. The number of mapped colors based on our SOM is larger than the number of other methods, which means our SOM has a stronger color mapping ability. e SOM-based image segmentation. Three different clusters are defined with the topology of output neurons. The original image has been segmented into three different sub-images, while the pixels in one sub-image are the nodes in the same cluster. The original image was segmented into three sub-images by different colors, while the flowers can be segmented red petal, yellow petal, and green leaf.

