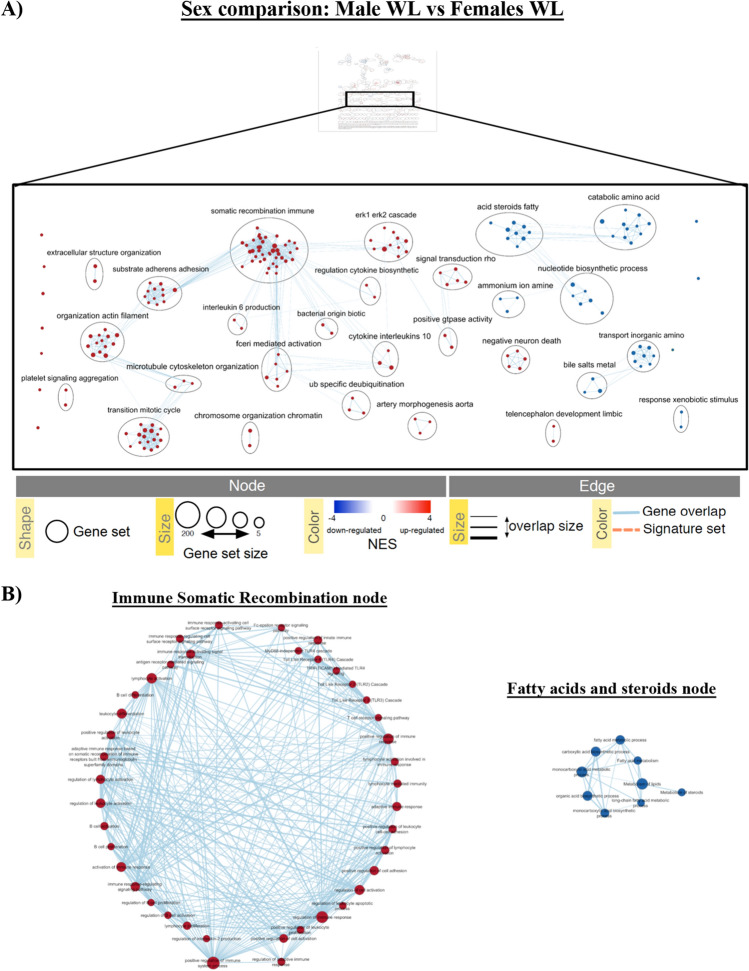
Figure 6.
Enrichment map example of over-represented genes in individual sex comparisons M.WL versus F.WL following GSEA analyses. (A) Representation of different clusters (nodes) regulated in the comparison. The map allows visualization of clusters containing nodes in which red and blue represent up- or down-regulated gene sets for each node, respectively. The clusters take their name from the most common containing names of the nodes within the cluster. (B) Example of the different gene sets that form somatic recombination immune and acid steroids fatty nodes, where red and blue nodes represent up- or down-regulated gene sets, respectively (FDR: 0.01–0.1).

