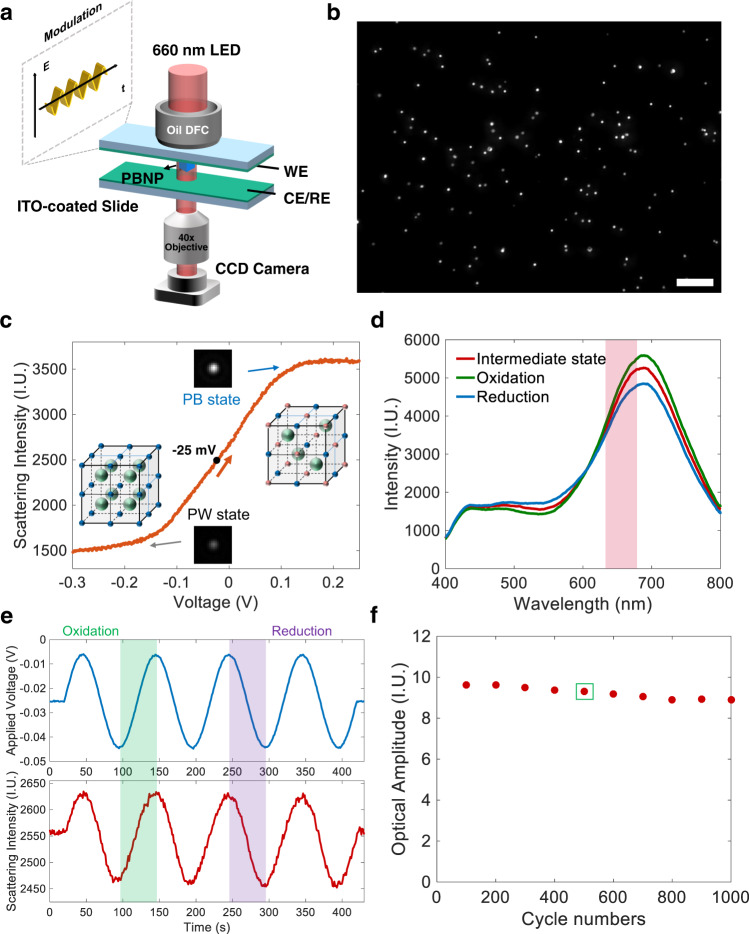
Fig. 1. The dark-field device for extracting scattering intensity of single PBNPs during potential modulation.
a Schematic illustration of monochromatic DFM coupled with electrochemical cell to measure the oEIS of single PBNPs. b Representative dark-field image of several tens of PBNPs. Scale bar: 10 μm. c Clear dependence of the scattering intensity of single PBNPs with the electrode potential was observed; the scattering intensity of the oxidized state (PB) was 2.3 times higher than that of the reduced state (PW). Scan rate was 5 mV/s. Crystal structures of PB and PW are also shown; blue sphere: Fe2+, red sphere: Fe3+, green sphere: K+. d Representative dark-field scattering spectra of single PBNPs at three different voltages: 5 mV (green), −25 mV (red), and −55 mV (blue). The red area is the wavelength range that we conduct dark-filed imaging. e Scattering intensity of single PBNPs as a function of sinusoidal potential modulation (frequency, 0.01 Hz; amplitude, 20 mV; offset, −25 mV). The green and purple area represent the oxidation and reduction process respectively. f Cyclability of single PBNPs for 1000 consecutive cycles during potential modulations (1 Hz); the average optical amplitude is extracted every 100 cycles. The detailed calculated process about the 400–500th cycles (green box inside) is provided in Supplementary Section 4. Source data are provided as a Source Data file.

