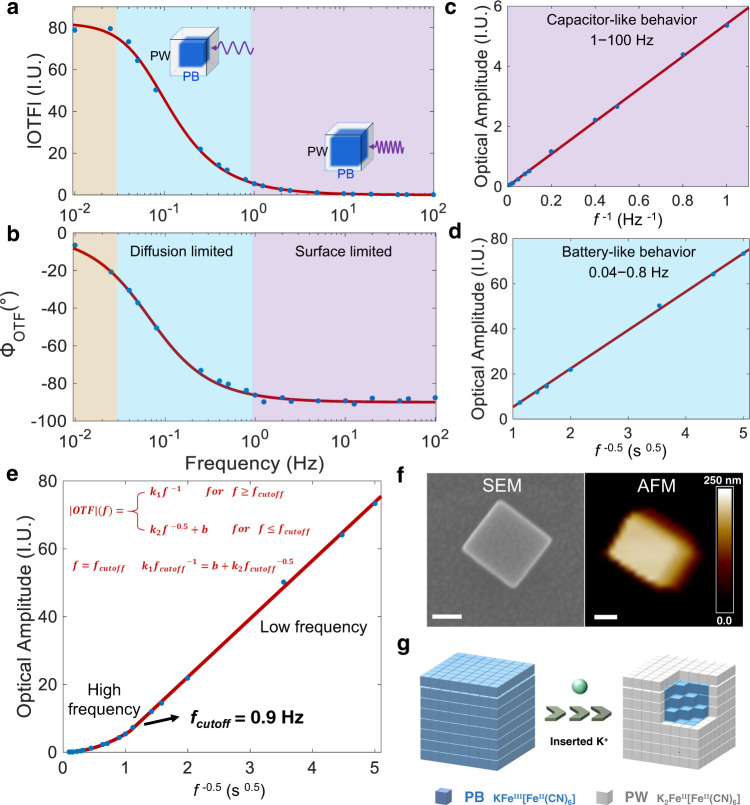
Fig. 2. The oEIS of single PBNPs and corresponding mechanism analysis.
a Bode plots of OTF amplitude and (b) phase of single PBNPs as a function of modulation frequency. The purple, blue and orange area represent the high-frequency region, low-frequency region and depletion region, respectively. The red line shows the simulated results from equivalent circuit which will be discussed in the following section (function 3&4), and the blue dots are experimental data. c Surface pseudocapacitive behavior in the high-frequency region. d Diffusion-limited behavior in the low-frequency region. e When plotting optical amplitude as a function of f−0.5, the dependence can be well fitted by a piecewise function as shown in the (e) inset to determine the corner frequency (fcutoff). The red line is the fitted results, and the blue dots are experimental data. f Correlative SEM and AFM images of the same PBNPs examined in (a–d). Scale bar: 100 nm. g Schematic diagram of the “shell-to-core” model showing the transformation from entire PB to PW. Source data are provided as a Source Data file.

