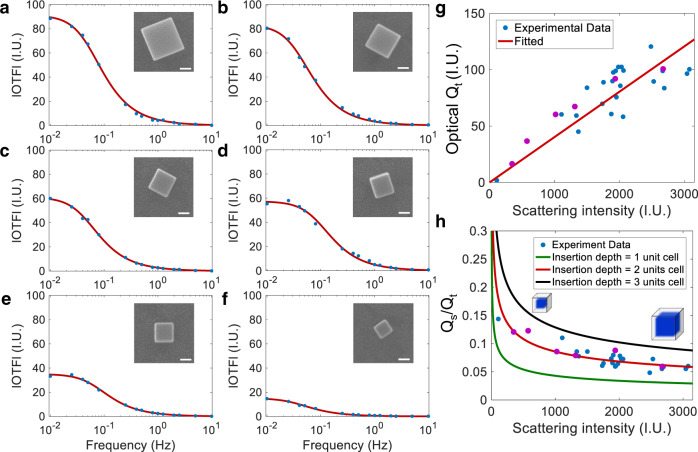
Fig. 3. The oEIS of different single PBNPs individual and the corresponding statistical results.
a–f The oEIS of six representative single PBNPs. The red line shows the fitted results, and the blue dots are experimental data. The top right corner is the corresponding SEM image. Scale bar: 100 nm. g Dependence of optical Qt and (h) Qs/Qt with the scattering intensity of single PBNPs by analyzing 30 individual species. Each dot represents an individual particle, and the dots corresponding to the six representative particles shown in (a–f) are marked in purple. The green, red, and black curves represent the theoretical Qs/Qt curves as a function of the nanoparticle size by assuming a shell-layer depth of 1, 2, and 3 unit cells, respectively. Source data are provided as a Source Data file.

