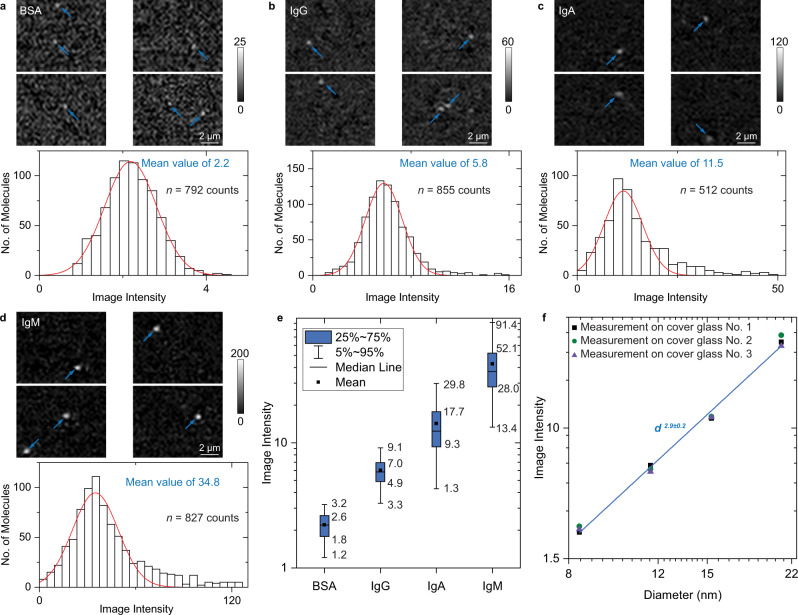
Fig. 2. Imaging single proteins with ESM.
a–d ESM images and image intensity histograms of BSA (a), IgG (b), IgA (c), and IgM (d) proteins, where the solid red curves are Gaussian fittings. Individual proteins are marked with arrows. Incident wavelength: 450 nm. Incident intensity: 60 kW cm−2. Camera exposure time: 5 ms. The ESM images of BSA, IgG, and IgA were achieved by subtracting the previous frame from each frame after averaging the raw images with a period of 50 ms. The ESM images of IgM were achieved by subtracting the previous frame from each frame without averaging. The sample sizes and mean values of the histograms are presented in each panel. e Box plots of image intensities measured on different proteins from (a–d). The sample sizes are presented in a-d, and the counts come from biologically independent molecules. The minima, maxima, and center values are 0.8, 4.4, and 2.2 for BSA, 1.1, 16.0, and 5.9 for IgG, 1.1, 50.0, and 12.4 for IgA, and 1.8, 148.9, and 37.1 for IgM, respectively. The bounds of box and whiskers are presented in the figure. The percentile is defined by mean value, which is 2.2 for BSA, 6.0 for IgG, 14.3 for IgA, and 42.7 for IgM, respectively. f ESM image intensity versus protein diameter measured by dynamic light scattering in logarithmic scale, where the z-distance dependence of evanescent wave is considered (Supplementary Note 1). The image intensities for each diameter were obtained from the peak values of the corresponding histograms for measurement on each of the three cover glasses. The histograms obtained from the measurements on different cover glasses can be found in Supplementary Fig. 10. The experiments were repeated three times with similar results for (a–d).

