Figure 3.
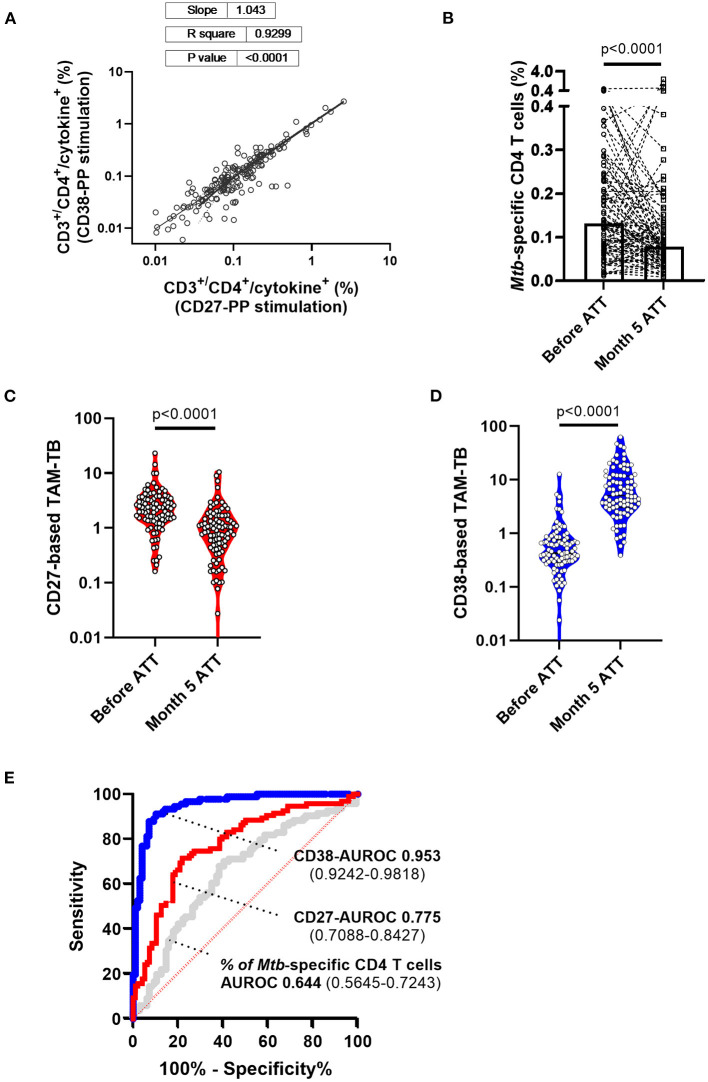
Superiority of CD38- over CD27-based T cell activation marker to attest TB infection resolution following 5 months of anti-tuberculous treatment. (A) Frequencies within CD3+/CD4+ cells of cytokine-producing cells across independent stimulation of peripheral blood mononuclear cells from the same patient and for both study visits i.e., before and after 5 months of anti-tuberculosis treatment (ATT). (B) Patient (lines) and median (box) response of the frequencies of antigen-specific T cells recalled by the synthetic peptide pool before and after 5 months of ATT (Month 5 ATT). Evolution of (C) CD27 and (D) CD38 T cell activation markers expressed by Mtb-specific CD4 T cell before and after 5 months of antibiotic treatment. (E) Receiver operating characteristic (ROC) curve and area under the ROC curve with 95% confidence interval showing the superior discriminatory power (Bootstrap test for two correlated ROC curves, p = 4.919e-06) of CD38- (blue curve) over CD27 (red curve) biomarkers to discriminate Mtb-specific CD4 T cell responses of patients before and after 5 months of chemotherapy. In comparison, the AUROC analysis of the variation of Mtb-specific CD4 T cell frequency alone (gray curve) before and after ATT displays substantially poorer accuracy.

