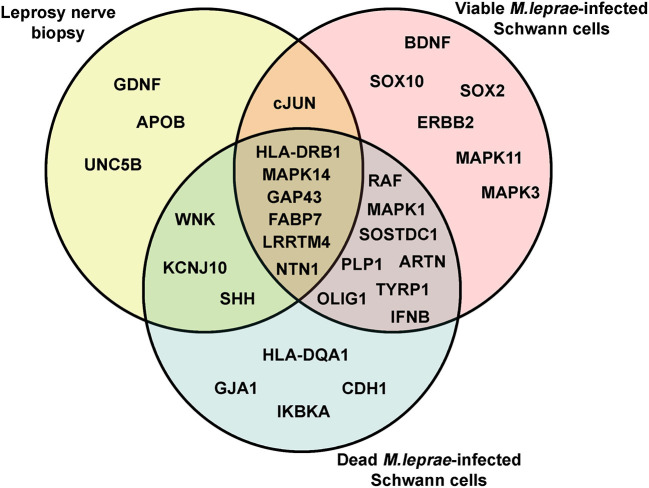
Figure 2.
The Venn diagram of differentially upregulated genes related to Schwann cell biology genetic signature in leprosy. The Venn diagram was used to identify clusters of overlapping and non-overlapping mRNA transcripts, upregulated in leprosy nerve biopsies and in Schwann cells infected with viable and dead M. leprae.

