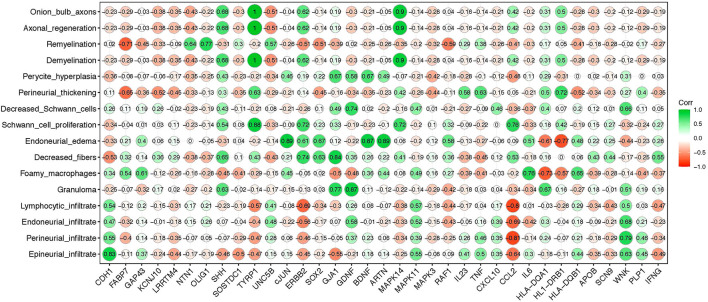
Figure 5.
Correlation matrix between leprosy histopathological alterations and gene expression profile in PNL patients. The y-axis indicates major nerve histopathological alterations observed in leprosy patients; the x-axis shows Schwann cell genes evaluated in PNL patients. The green color (closer to 1 value) means stronger correlation while the red color (closer to −1 value) means weaker correlation between the gene expression and the specific histopathological alteration, respectively.

