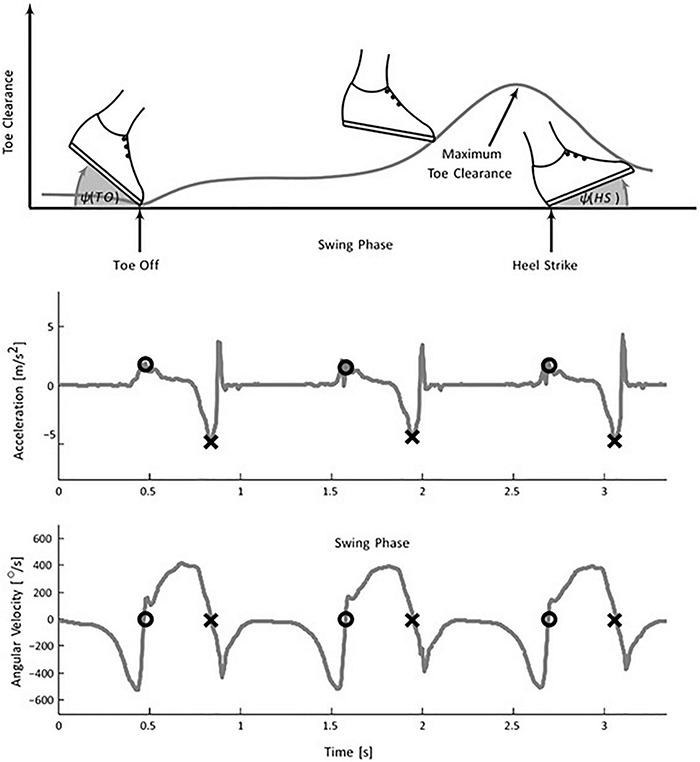
FIGURE 2.

Foot mounted inertial gait pattern in the sagittal plane. (Top) the plot shows a variation of foot angle (w.r.t. ground) at TO, HS, and toes clearance during the swing phase. The negative peak of the acceleration signal determines the HS (middle plot) whereas (lower plot) TO is extracted using the zero crossing of the angular velocity signal [Image source: Schülein et al. (2017), under Creative Commons Attribution 4.0 International License].
