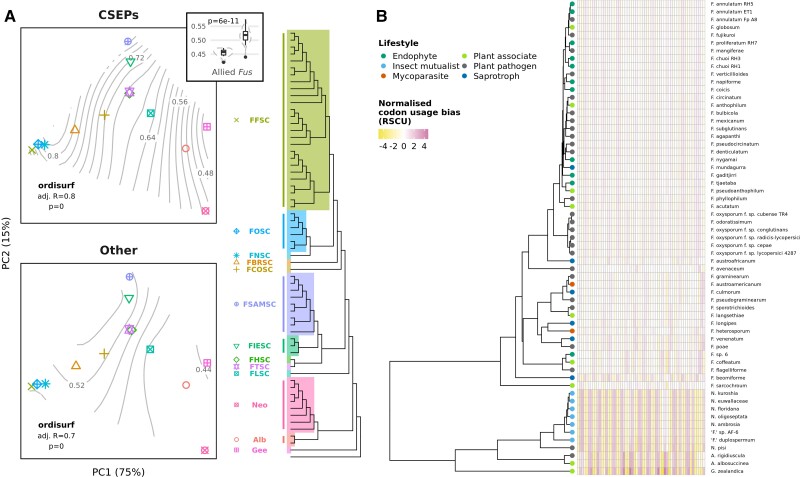
Fig. 5.
(A) PCA of phylogenetic distances between taxa, with points representing centroids for species complexes/allied genera, differentiated by shape and colour, as indicated by the tree legend. The percentage of variance explained by each principal component is shown on axis labels. Contours indicate the fit of codon optimisation (S values), of both core CSEPs and other core genes, to the ordination; the fit of CAZyme codon optimisation is not shown as it was not significant (P = 0.2). The inset boxplot shows the significant difference (t-test, P = 6e−11) in overall S values between Fusarium and allied genera. (B) Hierarchical clustering of taxa according to normalised codon usage bias (RSCU). Heatmap columns represent codons (excluding Trp, Met, and stop codons) with cells coloured by normalised RSCU, where positive values represent higher than expected codon usage and negative values represent lower than expected codon usage.

