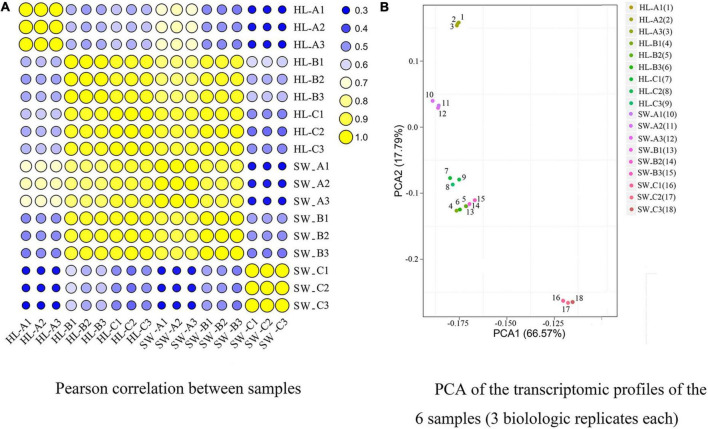
FIGURE 3.
Pearson’s correlation matrix (A) and principle component analysis (PCA) (B) of differentially expressed genes (DEGs) were performed on three biological replicates of each sample sets to evaluate correlations and variance between samples. “HL” and “SW,” “HongLi” and “Shuhe_Wuyingli” cultivars, respectively; A/B/C: bud infestation stage infestation/growth/maturation.

