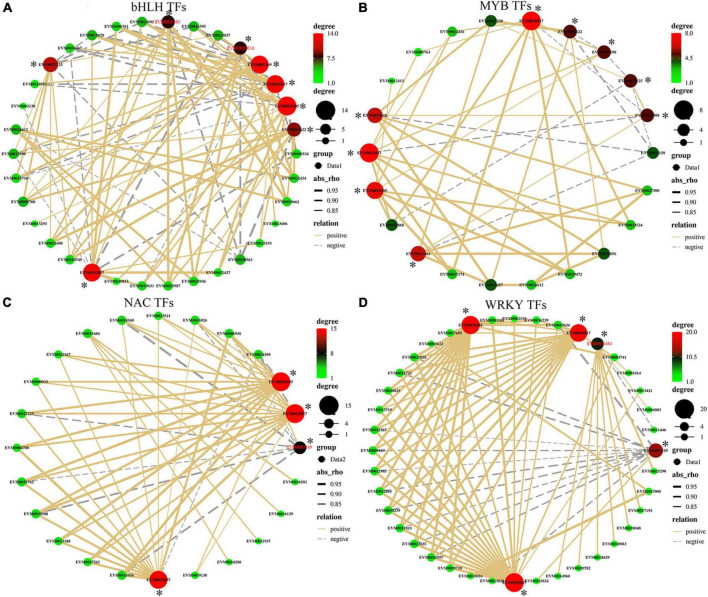
FIGURE 6.
(A–D) Correlation of gene expression between the four main DEG transcription factor (TF) families (i.e., bHLH, WRKY, NAC, and MYB) and peroxidase activity-related genes. Line color represent positive (solid yellow) and negative correlation (dotted gray); line thickness represents the strength of the correlation; dot size/color represents the number of correlated objects. * represents the antioxidant genes.

