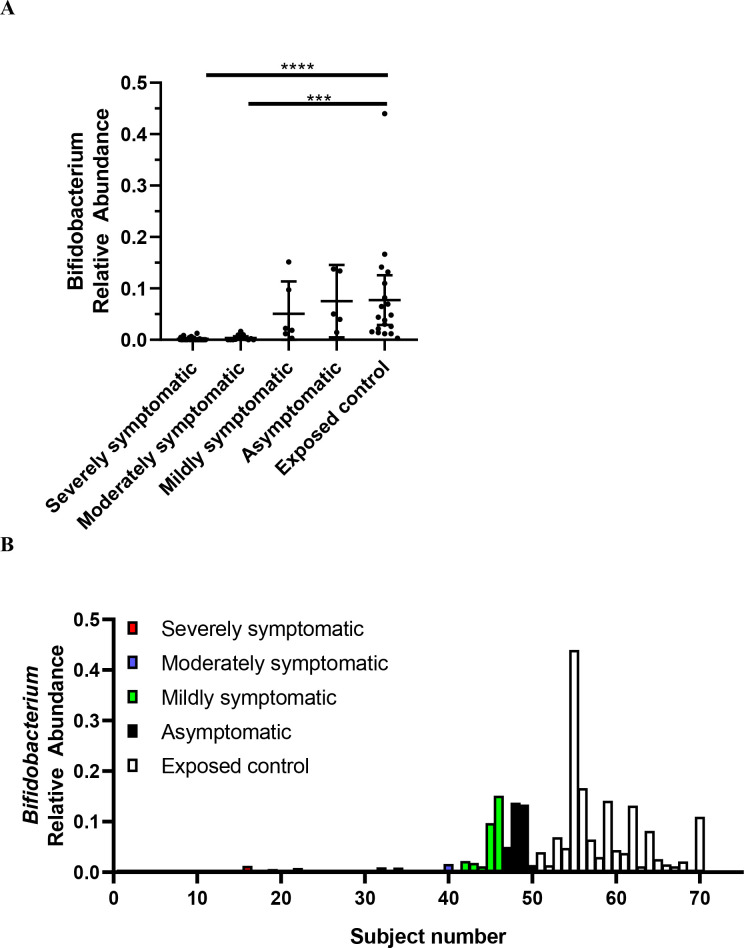
Figure 5.
Relative abundance of Bifidobacterium in SARS-CoV-2 positive patients (n=50) versus SARS-CoV-2 negative exposed controls (n=20). Data are plotted as (A) mean with error bars for 95% CI and (B) individual points of relative abundance for varying SARS-CoV-2 infection severity. Analysed via Kruskal-Wallis test, there were significant reductions in Bifidobacterium relative abundance for severely (p<0.0001) and moderately (p=0.0002) symptomatic patients. Subjects 1–28 = severely symptomatic; subjects 29–40 = moderately symptomatic; subjects 41–46 = mildly symptomatic subjects; subjects 47–50 = asymptomatic; subjects 51–70 = exposed control. Figure A, B depicts same data.

