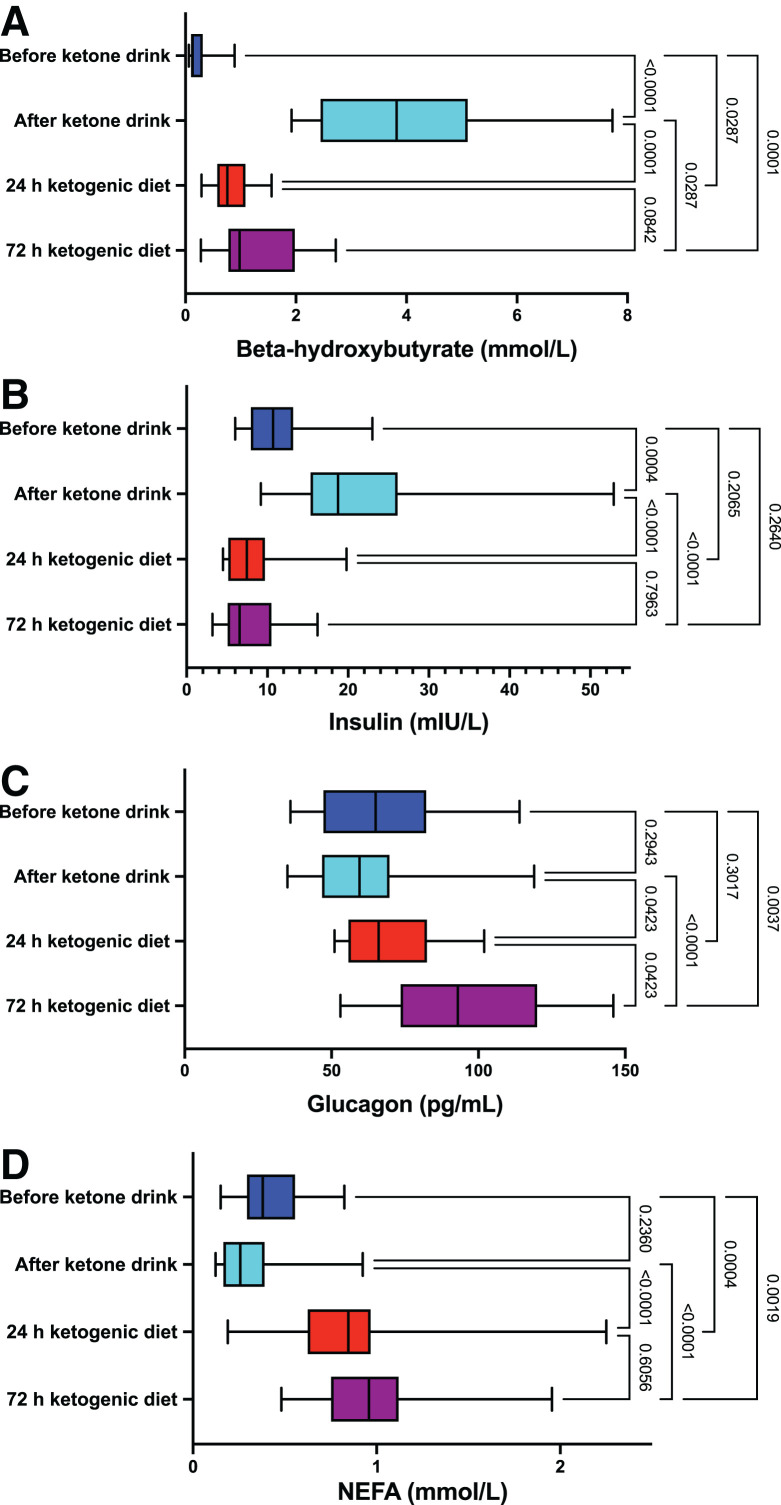
FIGURE 2.
Biomarker levels by study arm. Box-and-whisker plots for ketone (A), insulin (B), glucagon (C), and NEFA (D) levels are displayed by study visit for the 18 participants included in the modified intention-to-treat analysis. Whiskers depict minimum and maximum values. P values corrected for multiple testing.

