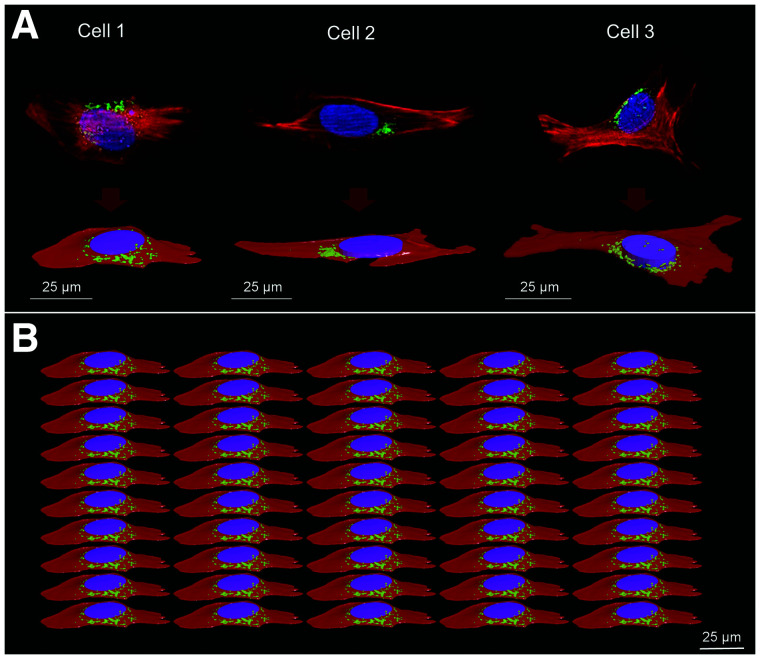
FIGURE 1.
Cellular morphologies. (A) 4Pi confocal microscope images with corresponding polygonal mesh structures. (B) Example of cell population representing modeled planar cellular cluster in Geant 4 (perspective view) where all cells are identical. Nucleus, G, and Cy are represented in blue/purple, green, and red, respectively. Cell population models reproduce confluence level of 50% ± 5%, estimated from radiobiologic observations. Geometric characteristics of the 3 cells are reported in Table 1.

