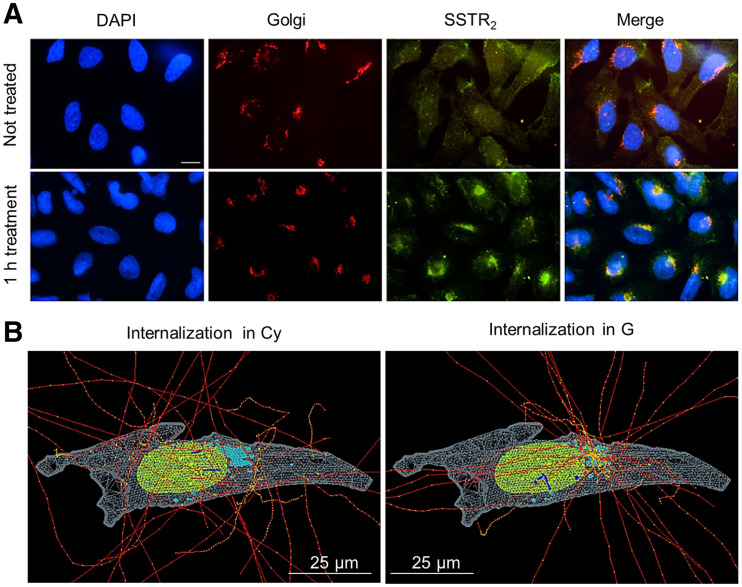
FIGURE 2.
Immunofluorescent staining of U2OS-SSTR2 cells and corresponding simulation hypotheses. (A) From left to right, images report nucleus, G, and SSTR2 stainings for untreated cells (top) and cells incubated with DOTATATE (bottom). Merged image at end highlights colocalization of SSTR2 with G after 1 h of incubation with DOTATATE. Scale bar = 5 µm. (B) Example of internalized source simulation for cell morphology 2. Nucleus, G, and Cy are reported in green, light blue, and light gray, respectively. Electron tracks are drawn in red, with yellow energy deposition points, which become blue when traversing nucleus.

