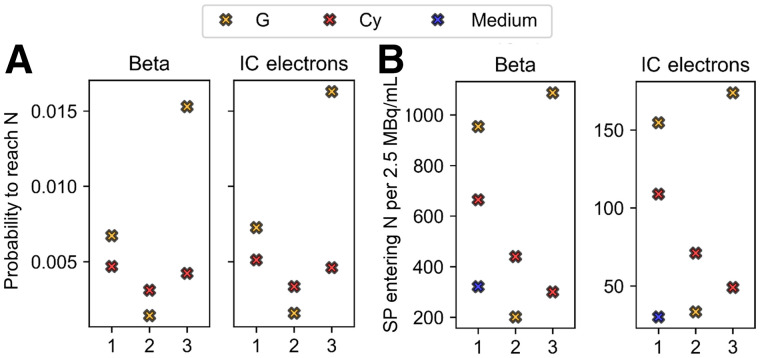
FIGURE 3.
Comparison between probabilities (A) and number (B) of SPs entering nucleus for 3 cell models, as indicated by x-axis, and the 3 source localizations (Cy, G [including contribution of CM], and medium when comparable to cell sources), including planar cross-irradiation. Number of particles entering nucleus refers to 2.5 MBq/mL of added activity to which experimental data correspond. Medium contribution is assumed to be same for the 3 morphologies on basis of simulations for cell 1. Each graph is subdivided into 2 windows corresponding to the 2 emission types (β and IC), as indicated by titles. N = nucleus.

