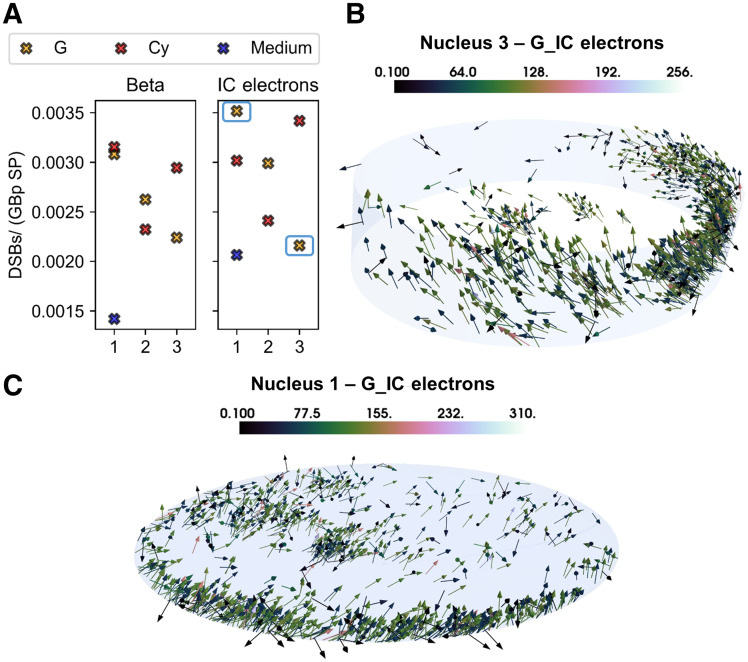
FIGURE 4.
Simulation results and graphical explanation. (A) DSB-yield (DSBs/Gbp SP) comparison for the 3 cell morphologies (as indicated by x-axis), the 3 source localizations (Cy, G [including contribution of CM], and medium), and the 2 emission types. Medium contribution is assumed to be same for the 3 morphologies on basis of simulations for cell 1. (B) Total nucleus irradiation (i.e., self- and cross-irradiation) characterizing nucleus 3 when IC electrons are emitted from G. (C) Total nucleus irradiation (i.e., self- and cross-irradiation) characterizing nucleus 1 when IC electrons are emitted from G. Color bars indicate energy (keV) at entrance of nucleus.

