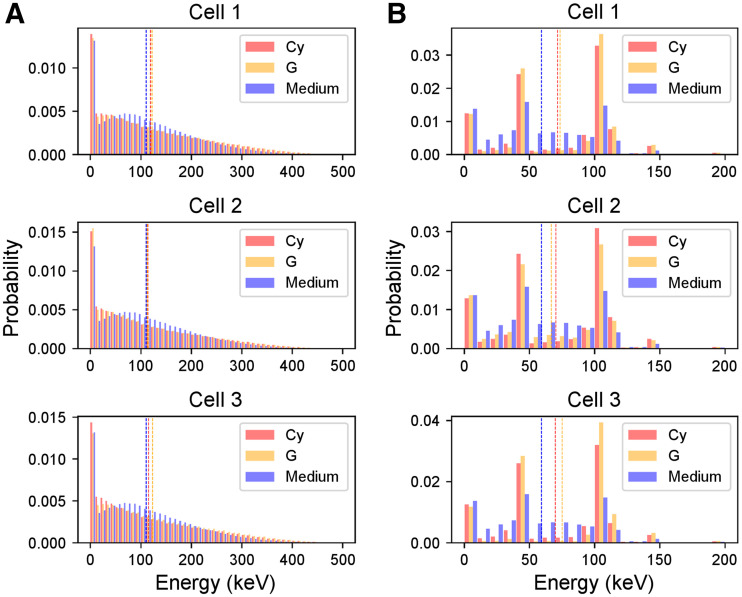
FIGURE 5.
Energy spectra of electrons entering nucleus of the 3 cell morphologies. (A) Distributions corresponding to β particles. (B) Distributions corresponding to IC electrons. Each color corresponds to the 3 source localizations (Cy, G [including contribution of CM], and medium). Dotted lines indicate mean value of energy spectra. Spectrum of medium is assumed to be same as cell 1 for the 3 morphologies and is replicated in each graph for comparison with cell sources. Energy bin is 10 keV.

