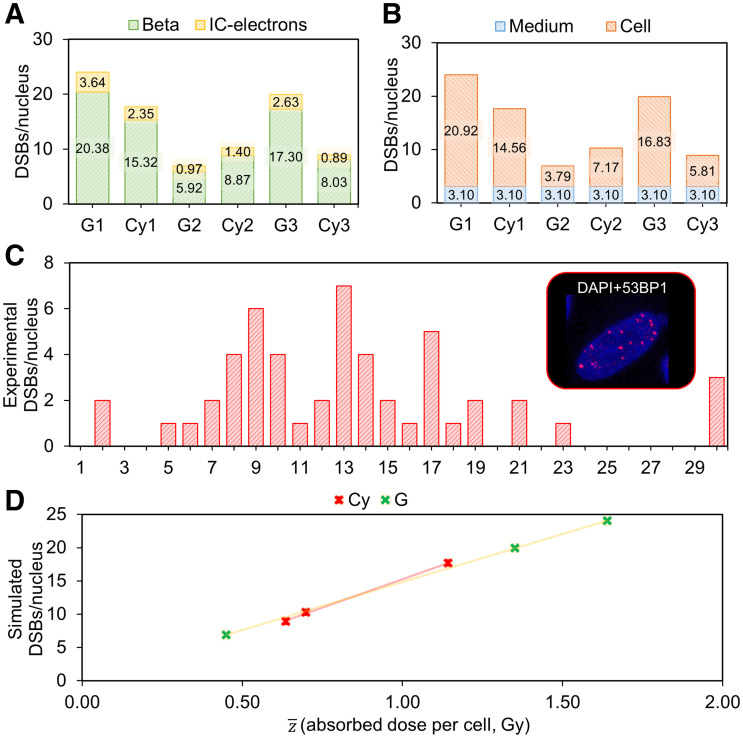
FIGURE 7.
DSB simulations, comparison with experimental data, and correlation with absorbed dose to nucleus. (A) Simulated number of DSBs per nucleus corresponding to the 3 cell morphologies and internalization hypotheses (Cy vs. G, including CM), indicating contribution of each particle type (β and IC electrons). (B) Simulated DSBs per nucleus corresponding to the 3 cell morphologies and internalization hypotheses (Cy vs. G, including CM), indicating contribution of medium or cell source (internalized and membrane-bound). (C) Frequency histogram of experimental number of DSBs per nucleus induced by 4 h of administration of 2.5 MBq/mL activity of 177Lu-DOTATATE, measured by 53BP1. (D) Linear correlations between absorbed dose to nuclei and simulated number of DSBs when internalized source is located in Cy and in G. DAPI = 4′,6-diamidino-2-phenylindole.

