Evaluated thermodynamic transfer parameters [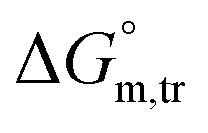 (kJ mol−1),
 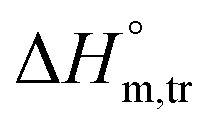 (kJ mol−1) and
 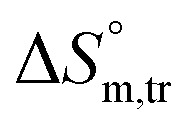 (J K−1 mol−1)] of the currently studied systemsa.
| CCFH (mmol kg−1) | T (K) |

|

|

|
|---|---|---|---|---|
| Water | 10 mmol kg−1 glucose | 10 mmol kg−1 fructose | ||
| 0.0 | 298.15 | −2.99/1.64/15.52 | −1.85/57.18/197.96 | |
| 0.0 | 303.15 | −3.25/−10.92/−25.31 | −2.39/48.75/168.69 | |
| 0.0 | 308.15 | −3.40/−24.49/−68.43 | −2.41/39.03/134.48 | |
| 0.0 | 313.15 | −2.38/−38.11/−114.09 | −1.79/28.15/95.59 | |
| 0.0 | 318.15 | −1.80/−52.32/−158.78 | −1.16/16.97/56.97 | |
| 0.5 | 298.15 | 23.54/29.08/18.59 | −1.47/28.16/99.36 | −0.55/41.18/139.96 |
| 0.5 | 303.15 | 24.26/32.03/25.63 | −1.44/24.89/86.85 | −0.54/35.50/118.90 |
| 0.5 | 308.15 | 24.88/35.71/35.14 | −1.55/21.30/74.12 | −0.74/29.26/97.36 |
| 0.5 | 313.15 | 25.17/39.49/45.75 | −0.95/17.23/58.05 | 0.08/22.24/70.77 |
| 0.5 | 318.15 | 25.91/43.04/53.84 | −0.18/13.32/42.42 | 0.60/15.13/45.67 |
| 1.0 | 298.15 | 23.72/−21.67/−152.25 | −1.01/36.4/125.74 | 0.18/−3.00/−10.66 |
| 1.0 | 303.15 | 24.37/−19.14/−143.52 | −1.01/34.73/117.89 | 0.15/−8.18/−27.45 |
| 1.0 | 308.15 | 24.92/−16.55/−134.57 | −0.95/32.75/109.35 | −0.08/−13.93/−44.95 |
| 1.0 | 313.15 | 25.33/−13.17/−122.96 | −0.12/30.13/96.57 | 0.63/−19.67/−64.81 |
| 1.0 | 318.15 | 25.96/−9.06/−110.07 | 0.41/27.81/86.14 | 1.08/−25.37/−83.14 |
| 2.0 | 298.15 | 23.94/30.78/22.96 | −0.23/25.21/85.33 | 0.65/24.94/81.48 |
| 2.0 | 303.15 | 24.26/30.91/21.94 | −0.16/24.21/80.39 | 0.66/22.06/70.60 |
| 2.0 | 308.15 | 25.14/31.52/20.71 | −0.41/23.19/76.59 | 0.47/18.96/59.99 |
| 2.0 | 313.15 | 25.43/31.48/19.31 | 0.45/21.61/67.58 | 1.35/15.29/44.50 |
| 2.0 | 318.15 | 26.41/30.93/14.21 | 1.14/20.38/60.46 | 1.86/11.79/31.23 |
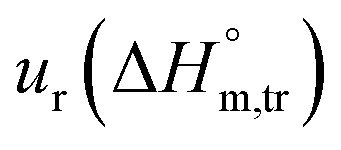
Relative standard uncertainty (ur) limits are 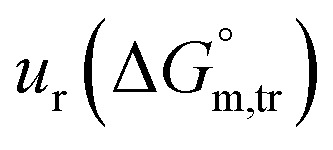 = ±3%,
  = ±4% and
 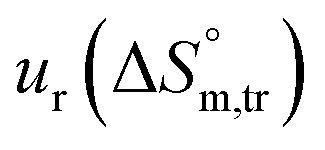 = ±5%.
