. 2020 Apr 7;10(24):14386–14395. doi: 10.1039/d0ra01410a

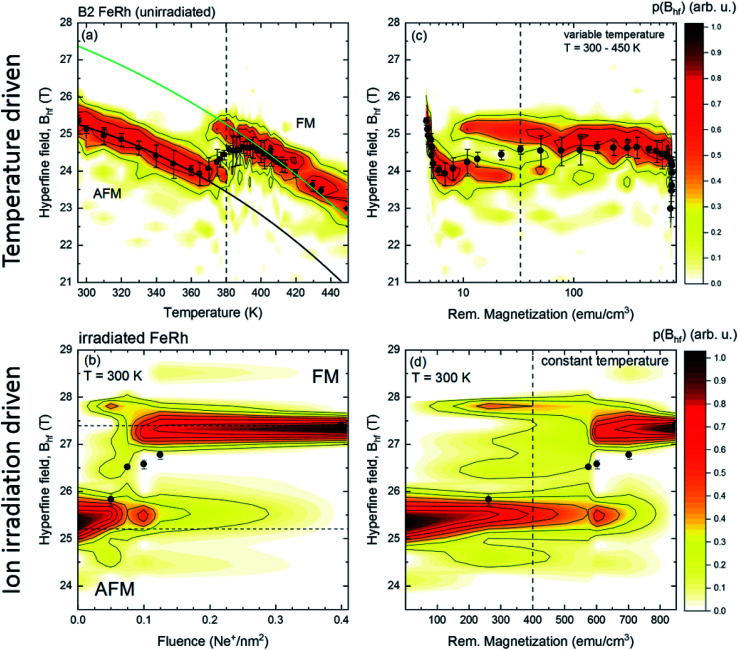
Fig. 3. Hyperfine field distribution p(Bhf) (color code) obtained from zero-field conversion electron Mössbauer spectroscopy for a 40 nm FeRh thin film. Subfigure (a) shows the changes of the hyperfine field distribution across the magnetostructural phase transition and subfigure (b) illustrates the hyperfine field distribution at 300 K for different disordered states obtained by ion irradiation with 25 keV Ne+ with different fluences. Subfigures (c) and (d) present the p(Bhf) distribution as a function of the macroscopic (remanent) magnetization obtained from temperature dependent (c) or field dependent measurements (d) shown in Fig. 1. The value of the average hyperfine field 〈Bhf〉 for each measurement is indicated with a black dot.

Fig. 3