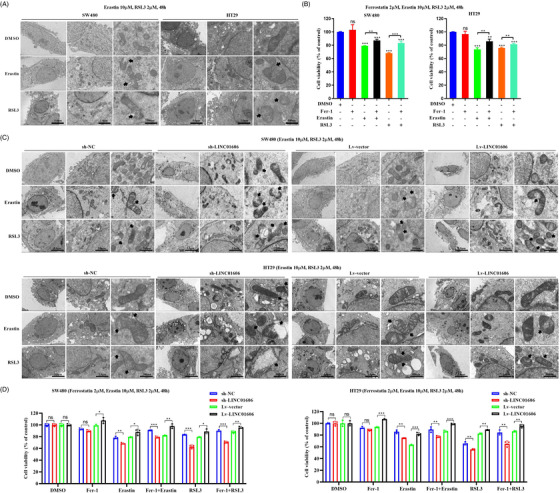
FIGURE 5.

Morphological changes of ferroptosis in colon cancer cells. (A) Transmission electron microscope images of mitochondria in SW480 and HT29 cells after treatment of DMSO, Erastin (10 μM) and RSL3 (2 μM) for 48 h. The black arrows indicate the outer mitochondrial membrane was ruptured and the mitochondrial cristae decreased or disappeared. Scale bars 5 μm, 2 μm and 100 nm. (B) A CCK‐8 assay was used to assess cell viability in SW480 and HT29 cells after treatment of DMSO, Ferrostatin‐1 (Fer‐1, 10 μM), Erastin (10 μM) and RSL3 (2 μM) for 48 h (n = 3). (C) Representative transmission electron microscopy images of mitochondria in LINC01606 stable knockdown or LINC01606 stable overexpression SW480 and HT29 cells after treatment of DMSO, Erastin (10 μM) and RSL3 (2 μM) for 48 h. Scale bars 5 μm, 2 μm and 100 nm. The black arrows indicate the outer mitochondrial membrane of neurons was ruptured and the mitochondrial cristae decreased or disappeared. Scale bars 5 μm, 2 μm and 100 nm. (D) A CCK‐8 assay was used to assess cell viability in LINC01606‐knowdown or LINC01606‐overexpressed SW480 and HT29 cells after treatment of DMSO, Ferrostatin‐1 (Fer‐1, 10 μM), Erastin (10 μM) and RSL3 (2 μM) for 48 h (n = 3). Data are shown as the mean ± SD. ns, no significant (p > .05), *p < .05, **p < .01 and ***p < .001 compared with control
