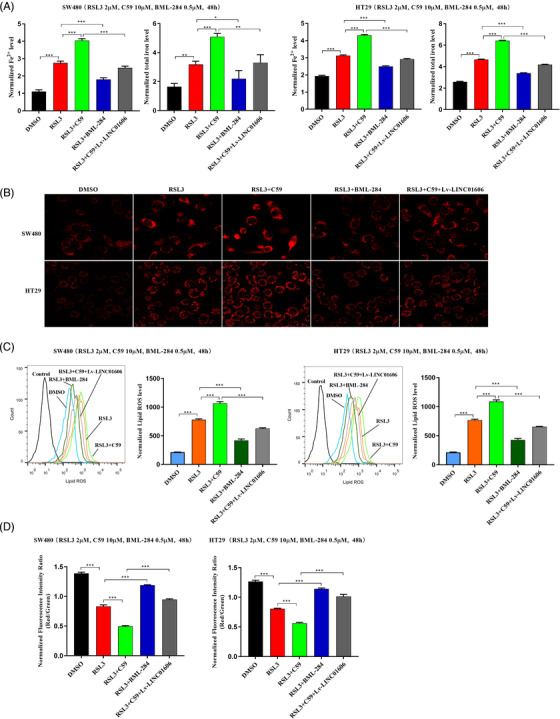
FIGURE 8.

LINC01606–Wnt/β‐catenin axis suppresses ferroptosis in colon cancer cells. (A) Levels of intracellular total iron and Fe2+ were analysed in SW480 and HT29 cells subjected to overexpressing LINC001606 or treatment of DMSO, C59 (10 μM), BML‐284 (0.5 μM) and RSL3 (2 μM) for 48 h (n = 3). (B) Representative images of intracellular mitochondrial superoxide level in SW480 and HT29 cells subjected to overexpressing LINC001606 or treatment of DMSO, C59 (10 μM), BML‐284 (0.5 μM) and RSL3 (2 μM) for 48 h (n = 3). Scale bars 2.5 μm. (C) Flow cytometry analysis the relative levels of intracellular lipid ROS in SW480 and HT29 cells subjected to overexpressing LINC001606 or treatment of DMSO, C59 (10 μM), BML‐ 284 (0.5 μM) and RSL3 (2 μM) for 48 h. (D) Levels of mitochondrial membrane potential were analysed in SW480 and HT29 cells subjected to overexpressing LINC001606 or treatment of DMSO, C59 (10 μM), BML‐ 284 (0.5 μM) and RSL3 (2 μM) for 48 h (n = 3). Data are shown as the mean ± SD. *p < .05, **p < .01 and ***p < .001 compared with control
