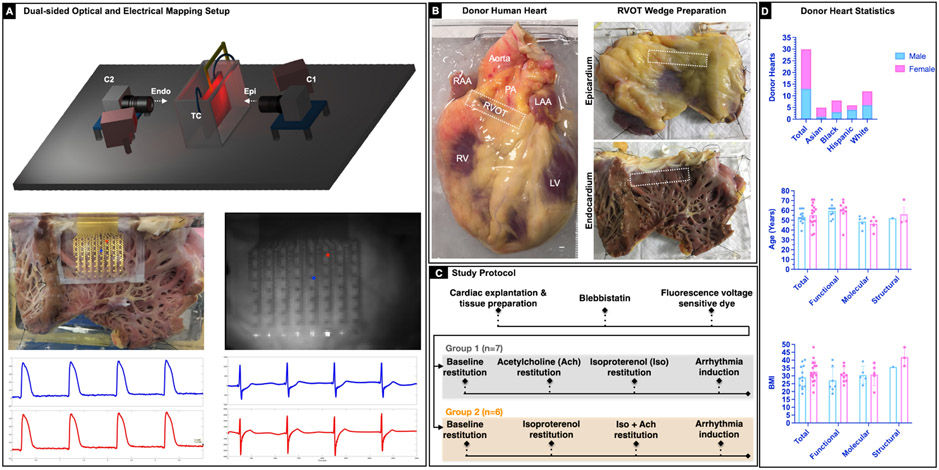
Figure 1. Experimental setup and study protocol.
A: Schematic of the dual sided optical mapping setup (top). 64-electrode passive stretchable and translucent array to record electrical signals simultaneously with optical signals. Representative sample optical action potentials and electrograms from two locations on the endocardial surface are shown (bottom). B: Representative donor human heart and right ventricular outflow tract (RVOT) tissue wedge preparation. The RVOT region is identified on the epicardial and the endocardial surface (marked with a white dotted rectangle). C: Study protocol that includes Group 1 (N=7) and Group 2 (N=6) hearts. Group 1 experiments focused on evaluating the effects of sympathetic (isoproterenol 100nM) and parasympathetic stimulation (100 μM) in isolation. Group 2 experiments focused on evaluating the effect of parasympathetic stimulation post sympathetic stimulation. Arrhythmia induction was attempted in all hearts using S1S1 protocol and/or 50Hz burst pacing. D: Bar graph depicting break down of the 30 donor hearts by sex, age, BMI, and type of study.

