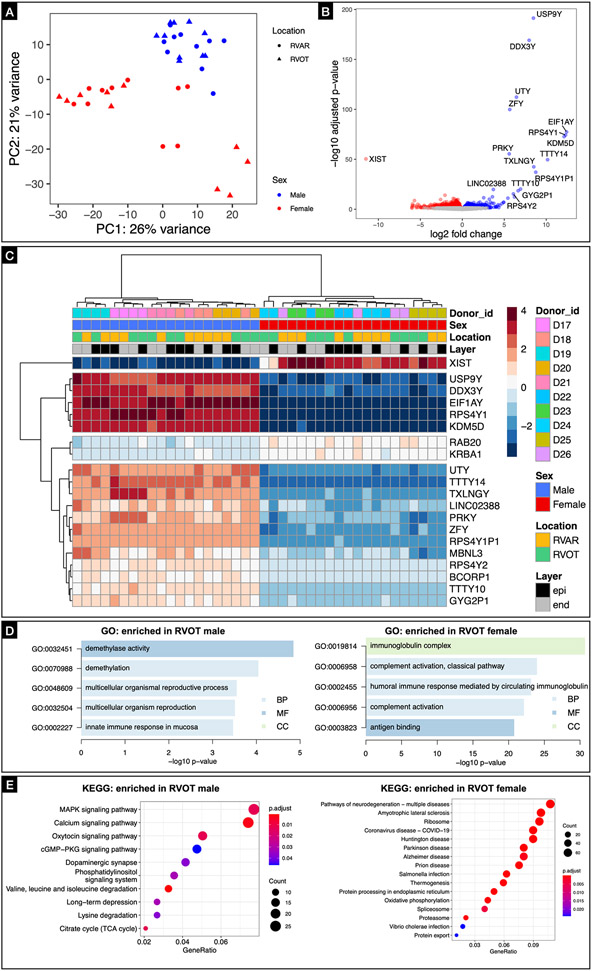
Figure 8: Transcriptome profiling of human RVOT.
A: Principal component analyses showed that the tissue samples were clustered together by sex along the first principal component, which accounted for 26% of the observed variance. B: Volcano plot showing sex altered expression of 261 genes in the RVOT. C: Hierarchical clustering of both genes and the samples based on the gene expression profile (DEGs) in the gene expression matrix, identifying the top 20 genes. D: GO analysis suggest a trend that these sex-regulated genes are mainly involved in immunoglobin complex, humoral immune response etc., in case of females and demethylase activity, demethylation etc., in case of males. E: KEGG analysis revealed the top 16 KEGG-annotated pathways enriched for DEGs expressed in male and female RVOT.

