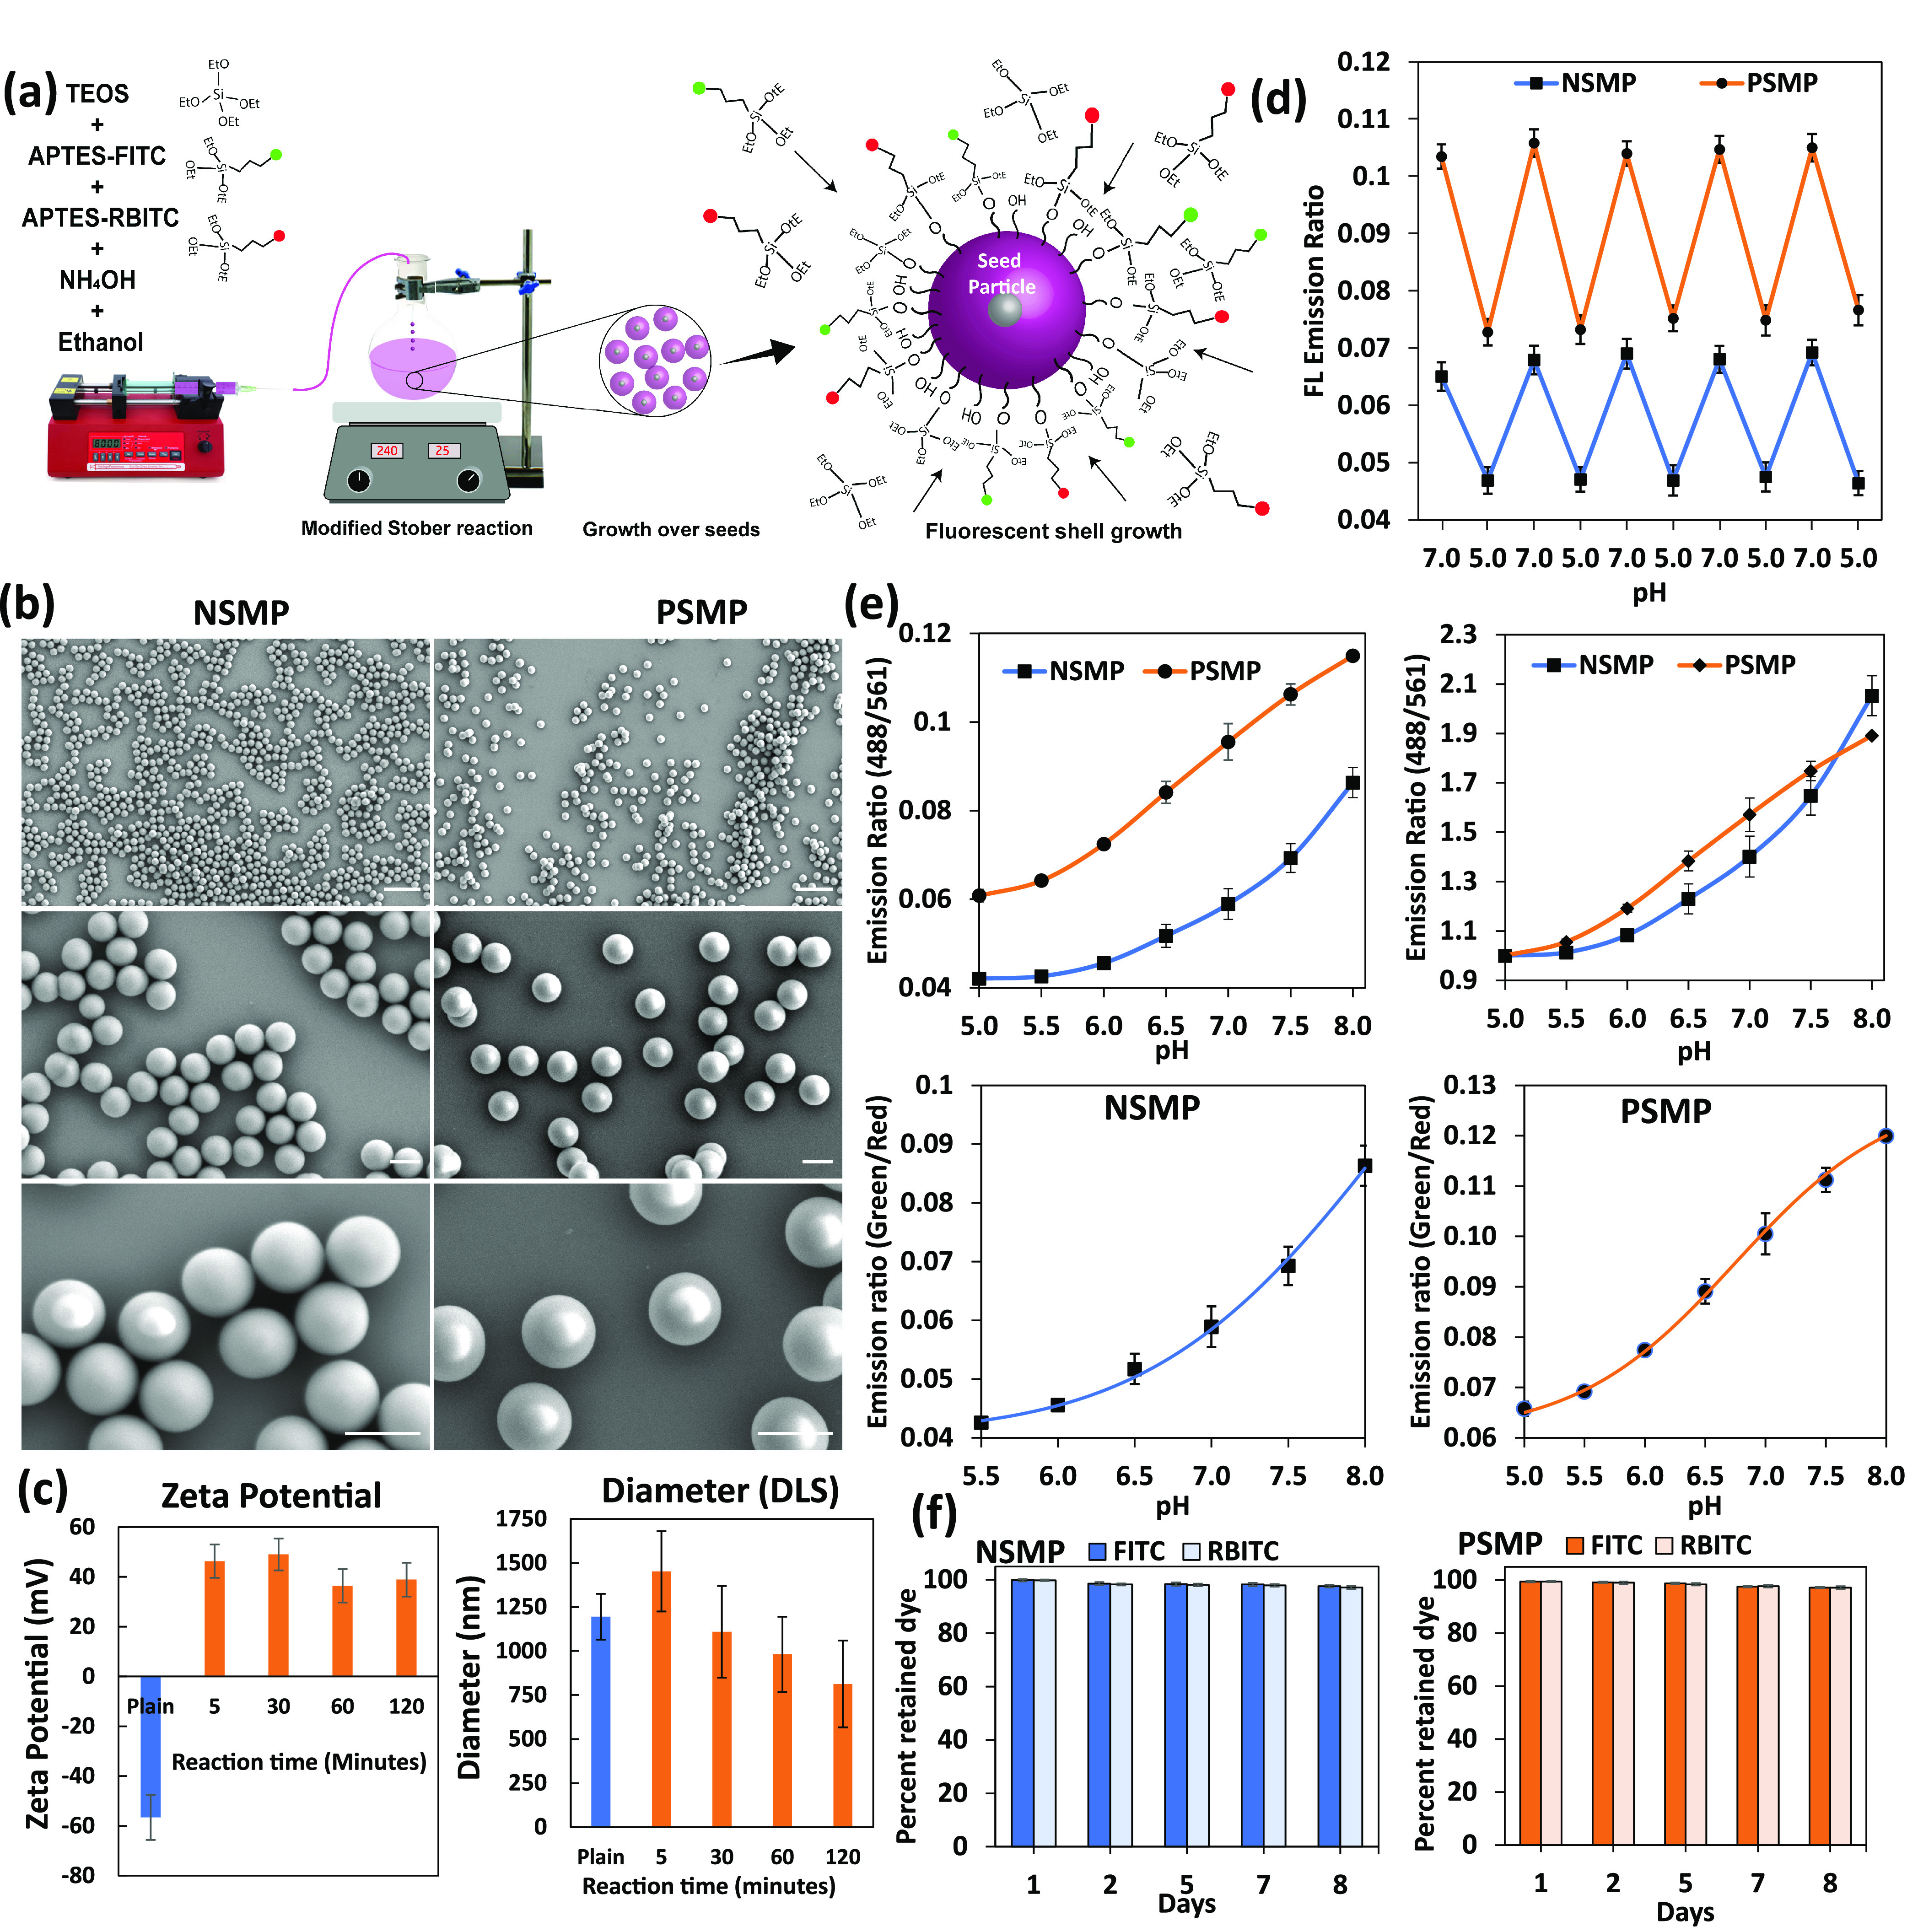
Figure 1.

Synthesis and characterization of negatively and positively charged pH-sensitive silica microparticles. (a) Synthesis steps of pH-sensitive fluorescent silica microparticles by the modified Stöber method. (b) SEM images of (left columns) of NSMPs and (right column) PSMPs at different magnifications. Scale bars: top panels: 5 μm; middle and bottom panels: 1 μm. (c) (Lft panel) ζ Potential data showing charge values on NSMPs (plain) and PSMPs; (right panel) DLS data showing the diameter for NSMPs (plain) and PSMPs over reaction time. (d) Reversibility of fluorescence emission ratios of PSMPs and NSMPs with cyclic pH 5.0 and pH 7.0 showing the conserved sensitivity or robustness of the particles. (e) (Upper panels) Difference in fluorescence emission ratios (488nm/561nm) of PSMPs and NSMPs under known pH values. Un-normalized (left) vs normalized (right) fluorescence ratios (488nm/561nm) of PSMPs and NSMPs. (Bottom panels) Best fitting of pH vs emission ratio with Boltzmann regression for PSMPs and logistics regression for NSMPs. (f) Plots showing the retention percentage of FITC and RBITC dyes from PSMPs and NSMPs on different days of dialysis.
