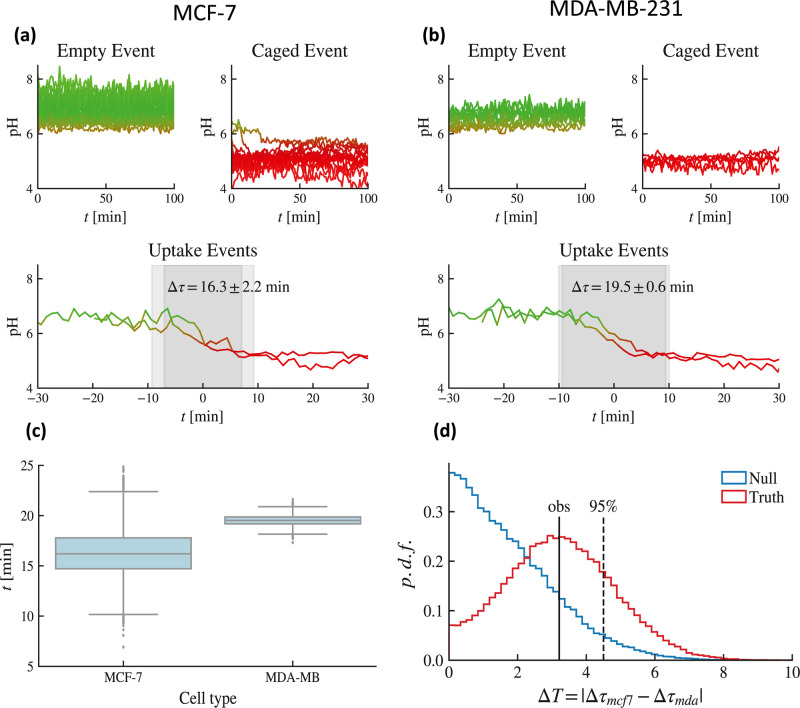
Figure 5.
Estimates of the acidification time. (a) Outer, inner (top), and caging (bottom) evolution of recorded pH vs time for MCF-7 cells. (b) Outer, inner (top), and caging (bottom) evolution of recorded pH vs time for MDA-MB-231 cells. (c) Box plot of the distribution of the acidification time: while the mean are somehow close, resulting in Δτ = 16.3 min for the MCF-7 type and Δτ = 19.5 min for the MDA-MB-231 type, the former exhibits a much broader variability as the relative standard deviations read as 2.2 min vs 0.6 min. (d) Hypothesis test on the statistical value of the difference between the two acidification times suggesting that the temporal gap between the two average acidification times related to the two cellular types is not significant.

