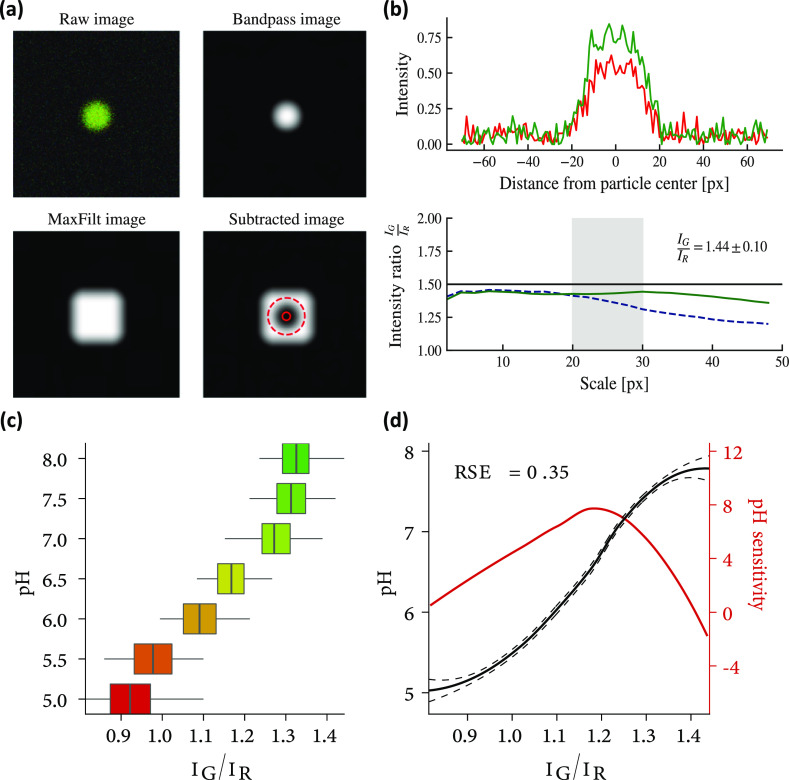
Figure 6.
Converting a light signal into a chemical measurement. (a) Summary of the four main steps to identify a sensor. The original image (top left) is filtered by a low-band filter (top right) to detect the maximum intensity pixel, locating the probe. This white sphere is then enlarged by a max-filter algorithm (bottom left), and by subtracting the original image from the resulting white square, the final image (bottom right) is obtained. (b) Intensity of the original image as presented in the previous (top) panel. Different methods to evaluate the ratio IG/IR: the ideal case is the black horizontal line, a standard algorithm (e.g., the direct evaluation of the ratio between the two intensities) behaves as the dotted blue line, and the green line traces the behavior of our algorithm, over-performing with respect to the standard route.66 Note that the gray area ranges from 20 to 30 pixels as, by a glance at the upper plot, it is evident that the probe is occupying at least 20 pixels and reasonably no more than 30. (c) Check that the new approach to probe identification and light measuring produced a monotonic calibration curve. (d) Refined interpolation of the calibration curve shown in panel (c) equipped with error bars at the confidence level of ±1σ (continuous black line and relative dotted black lines) and its sensibility curve (i.e., the derivative of the pH vs the ratio of intensities) aiming to highlight where (i.e., at which values of IG/IR ratios) the probes are best performing.

