. 2020 Apr 17;10(26):15252–15263. doi: 10.1039/d0ra01776k

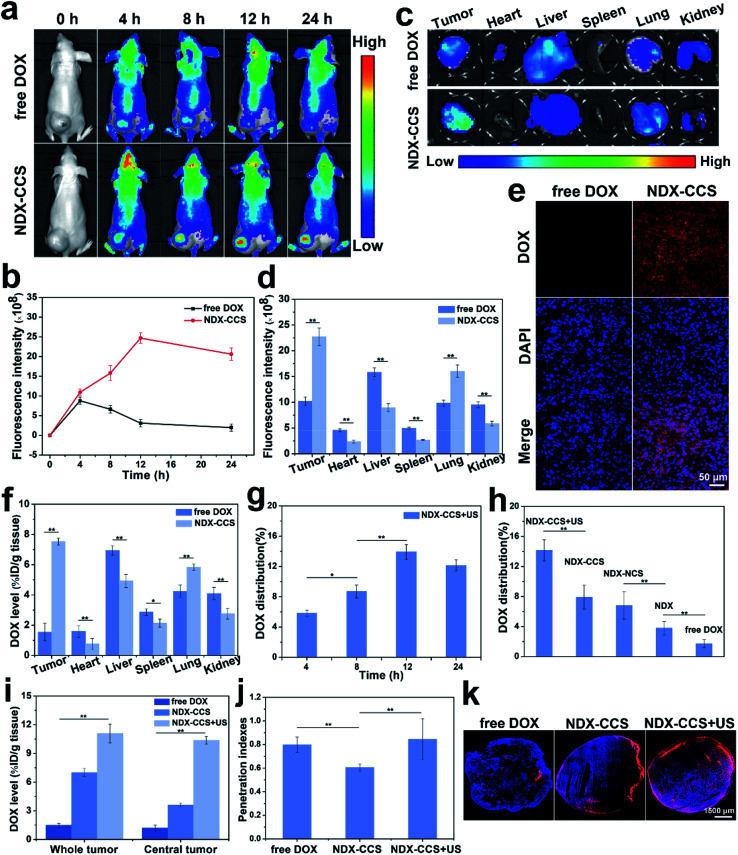
Fig. 4. In vivo drug biodistribution and penetration. (a) In vivo fluorescence images and (b) changes of fluorescence signal intensities of tumors in HepG2 tumor-bearing mice after i.v. injection of free DOX or NDX–CCS at predetermined time points. (c) Ex vivo fluorescence images and (d) corresponding fluorescence intensities of major organs and tumors dissected from mice 24 h post injection. (e) CLSM images of tumor cryosections at 24 h following i.v. injection. (f) Distribution profiles of total DOX in tissues at 24 h after a single i.v. injection of free DOX or NDX–CCS. (g) DOX content of tumor in the NDX–CCS + US-treated mice at different intervals. (h) DOX content of tumor at 24 h post injection in different formulations-treated mice. (i) Quantitative analysis of DOX concentrations in whole and central regions of tumors in mice after a single i.v. injection of free DOX or NDX–CCS for 24 h followed by different treatments. (j) Penetration indexes of free DOX, NDX–CCS and NDX–CCS + US (values are means ± SD, *P < 0.05, **P < 0.01, n = 6). (k) CLSM images of drug distribution in tumor cryosections. The equivalent dose of injected DOX was fixed at 10 mg kg−1.

Fig. 4