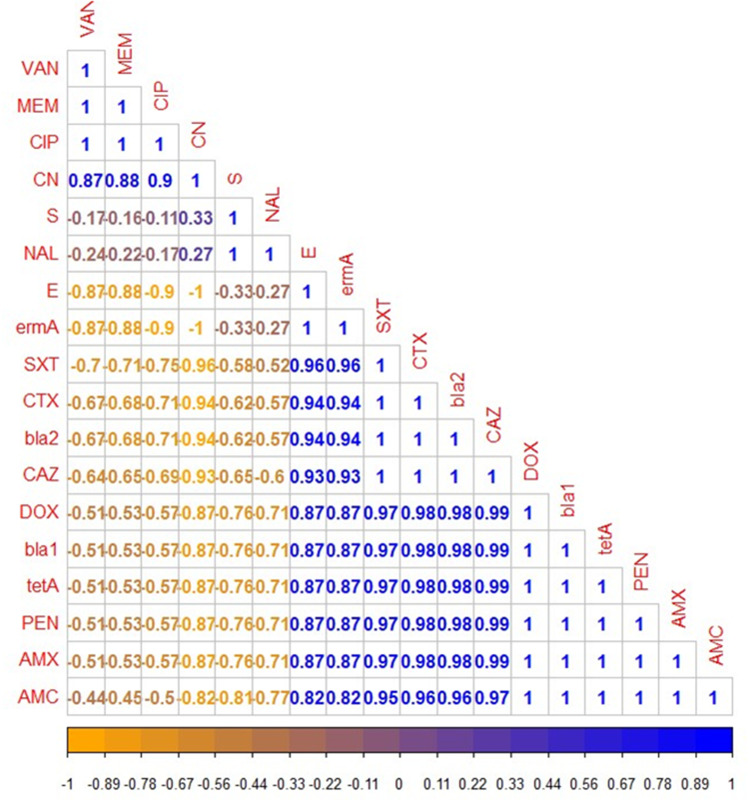
Figure 10.
The heat-map illustrates the correlation coefficient (r) among the antibiotic resistance genes detected in the recovered B. cereus isolates and various tested antibiotics. The intensity of colors indicates the numerical value of the correlation coefficient (r), Orange, and blue color refers to the negative and positive correlations, respectively.

