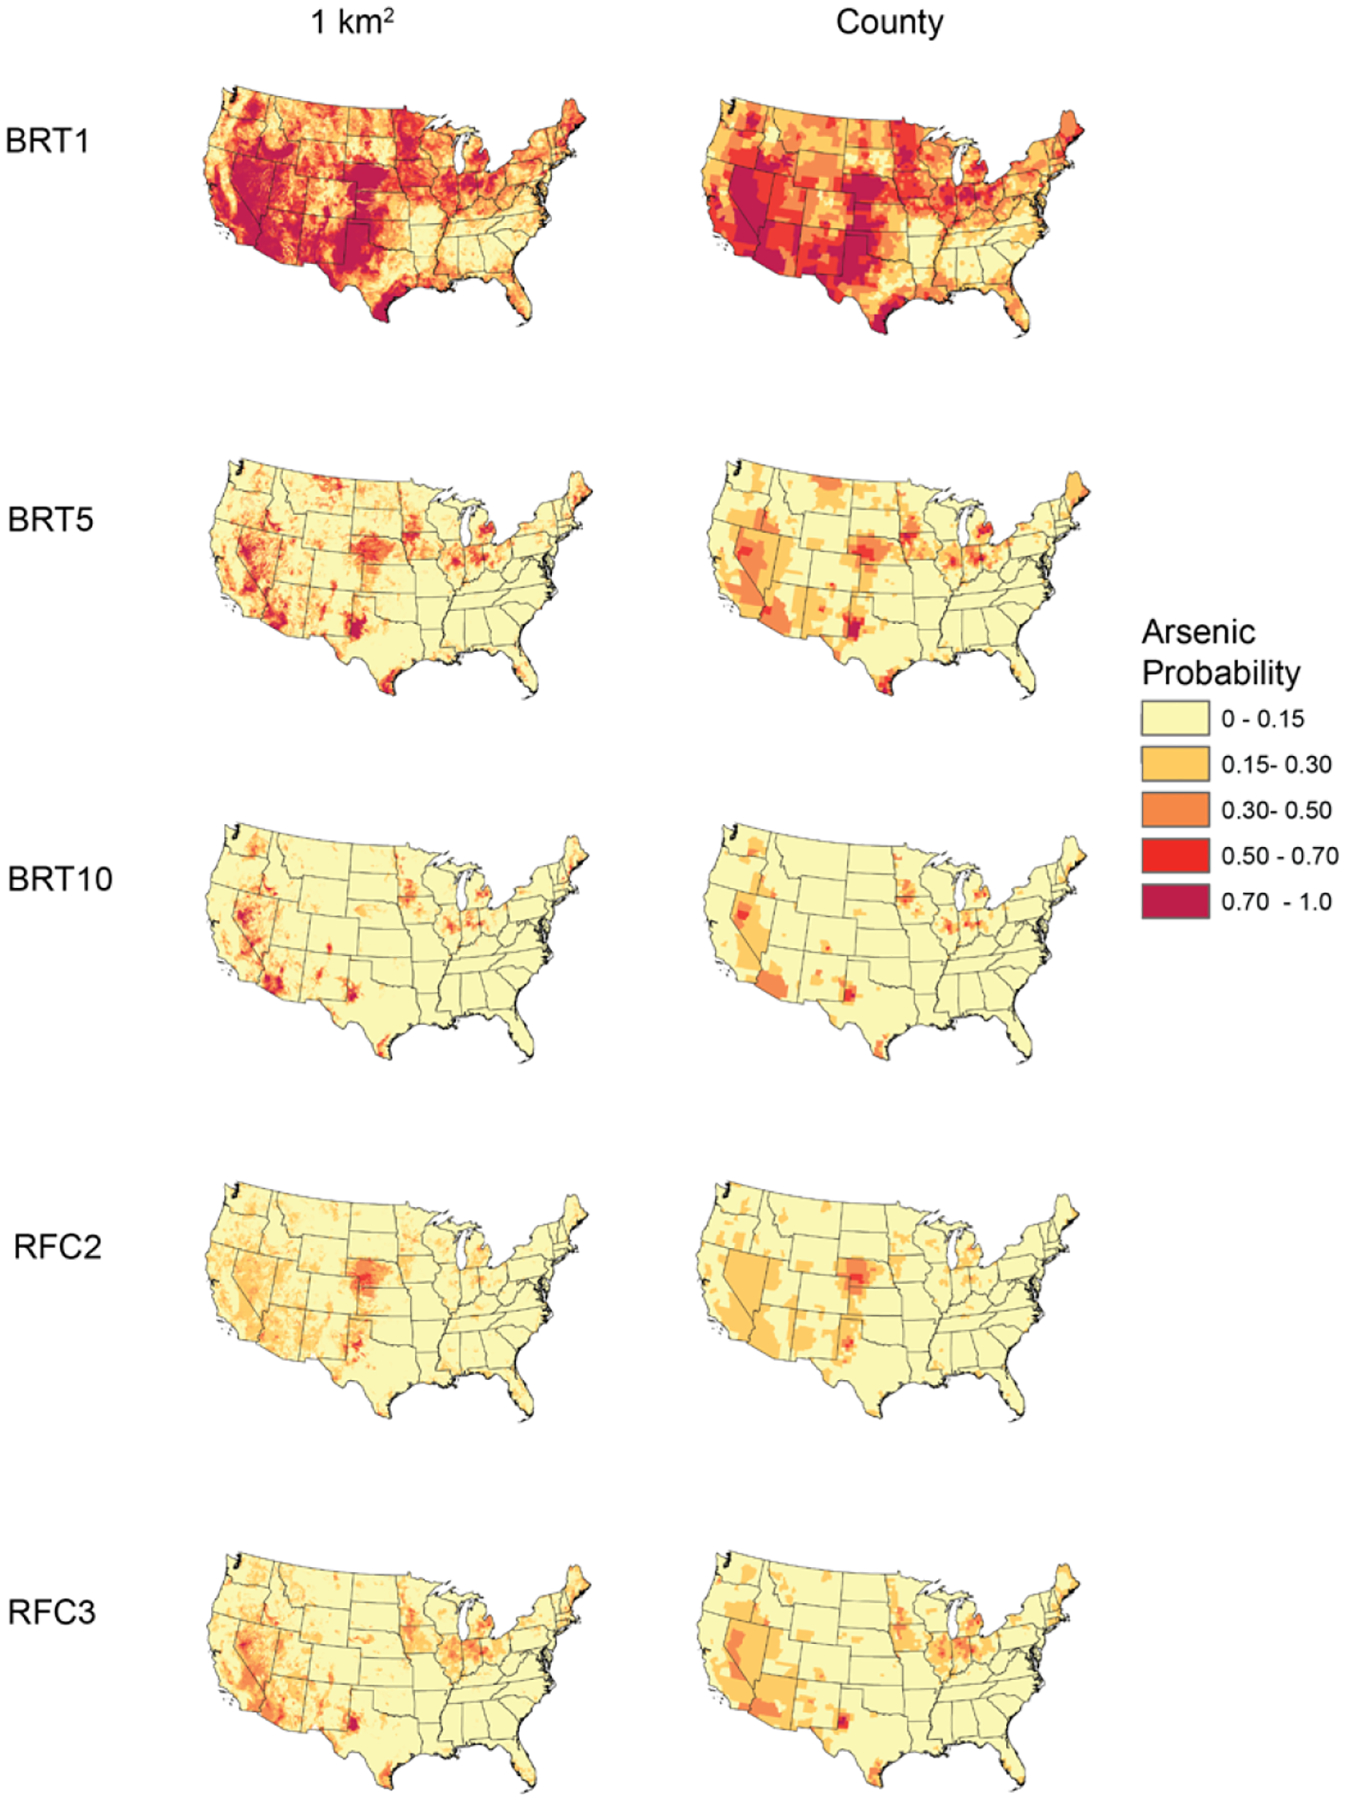
Figure 1.

Machine Learning Model-Predicted Arsenic Probabilities at 1 km2 and Aggregated to the County-Level.
BRT1 refers to the probability that arsenic concentrations exceeded 1 μg/L as predicted by a boosted regression tree; BRT5 refers to the probability that arsenic concentrations exceeded 5 μg/L as predicted by a boosted regression tree; BRT10 refers to the probability that arsenic concentrations exceeded 10 μg/L as predicted by a boosted regression tree; RFC2 refers to the probability that arsenic concentrations fell between >5 to ≤10 μg/L whereas RFC3 refers to the probability that arsenic concentrations exceeded 10 μg/L, with both probabilities predicted by a single random forest classification model.
