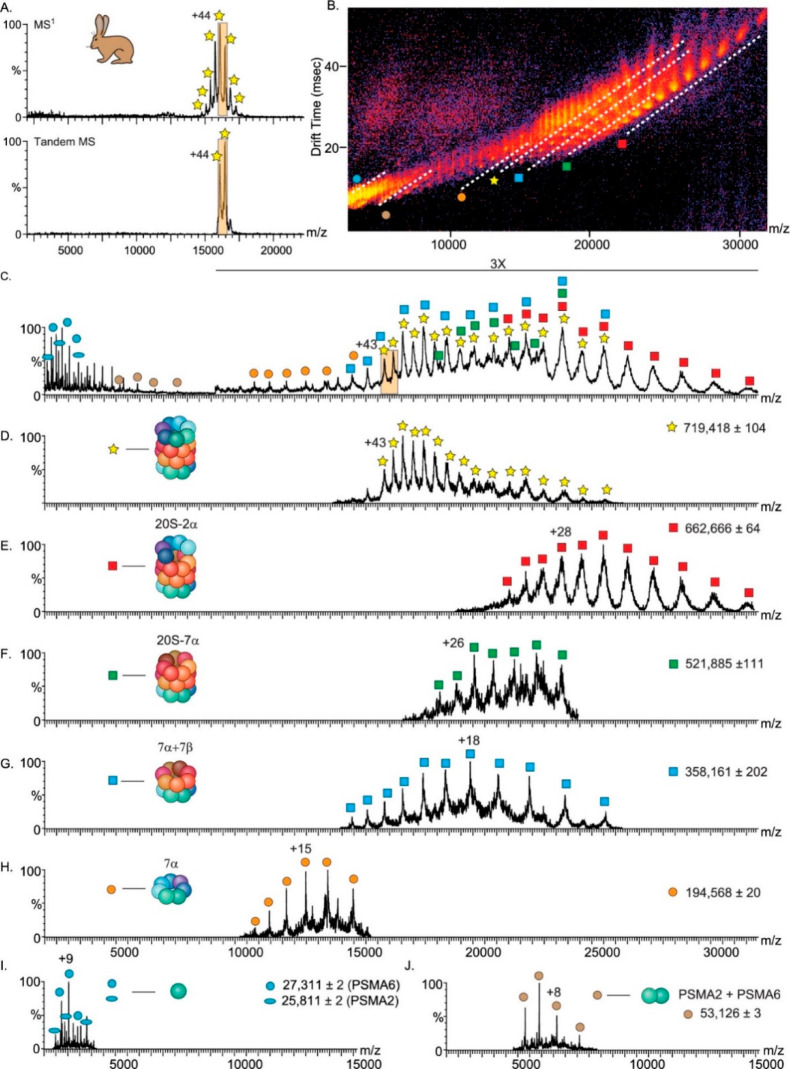
Figure 13.
20S proteasomal particles analyzed by surface-induced dissociation (SID) combined with ion mobility mass spectrometry (IM-MS). SID-IM-MS spectra of the rabbit 20S proteasome complex reflect the cylindrical topology of the complex. (A) Charge-reduced rabbit 20S proteasome precursor ions were measured on a Synapt G2 instrument equipped with an SID cell (top), and the 43+ and 44+ charge states were isolated (bottom) and accelerated into the surface at 150 V. (B) IM-MS plot of the SID spectra of the rabbit 20S proteasome. The separation in drift time (vertical axis) assists in the discrimination of species that overlap in m/z (horizontal axis), as shown in (C). The major populations of the dissociation products are designated by dashed lines in (B) and labeled with symbols that are graphically depicted in (D–J). The extracted m/z spectra from the underlined regions in the IM-MS plot (D–J) show the identified dissociation products. Reproduced from ref (216). Copyright 2020 American Chemical Society.

