Figure 18.

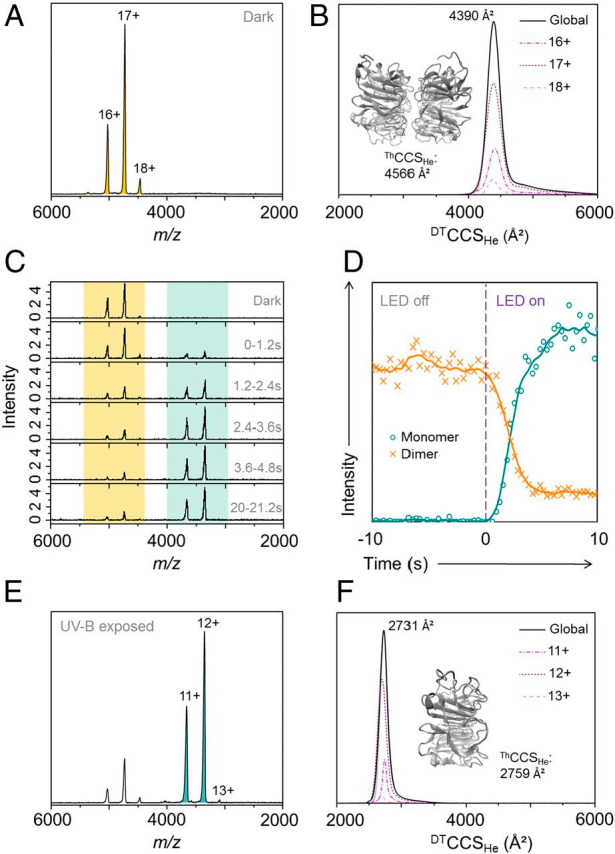
Native MS and IM-MS of the UVR8 photoreceptor core domain (UVR812–381). (A) Native mass spectrum of the UVR812–381 dimer (pale-orange peaks) in the absence of UV-B light. (B) Monodisperse drift tube collision cross section in helium (DTCCSHe) of the UVR8 dimer. The inset shows the energy-minimized structure of the UVR8 dimer and associated theoretical CCS (ThCCSHe). (C) Mass spectra of UVR812–381 as a function of illumination time (280 nm, 25 mW, 350 mA). Mass spectra were combined over a period of 1.2 s after the light-emitting diode (LED) was switched on at t0. Dimer signal, pale orange; monomer signals, pale green. (D) Ion chromatograms extracted for the UVR812–381 dimer (orange) and monomer (green) as functions of acquisition time. Data to the left of the purple dashed line are from when the ion source tip was in the dark, and the data to the right are from when the tip was illuminated. (E) Native mass spectrum of UVR812–381 following illumination in the source tip with the 280 nm LED for 10 s (to ensure maximum conversion). The spectrum is now dominated by the UVR812–381 monomer (pale-green peaks). (F) Monodisperse DTCCSHe of the UVR812–381 monomer. The inset shows the energy-minimized structure of the UVR812–381 monomer and associated ThCCSHe. From ref (313). CC BY 4.0.
