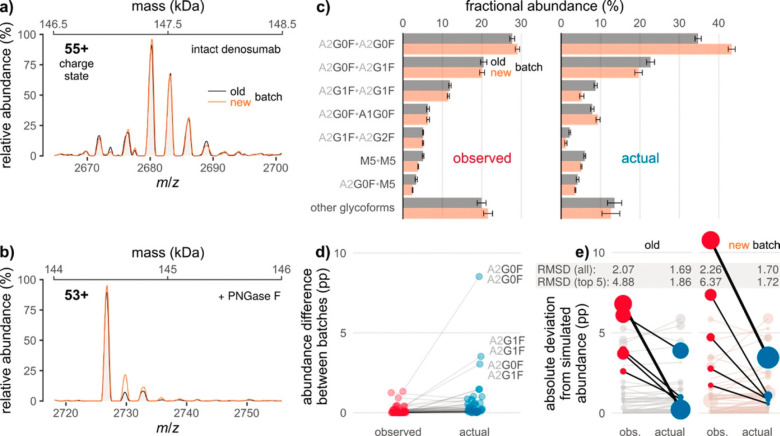
Figure 20.
Eliminating hexosylation bias in glycoproteoform profiling by high-resolution native MS. Glycation obscures differences between the glycoform profiles of two batches of Prolia (old vs new). (a, b) Raw mass spectra of the (a) intact and (b) de-N-glycosylated mAb, corresponding to 2 kDa sections of the respective zero-charge spectra (the secondary x axes indicate the respective masses). (c) Fractional glycoform abundances before and after correction for the effects of glycation. (d) Interbatch differences of glycoform abundances as derived from (c). Lines connect points denoting identical glycoforms. The three most common glycoforms are labeled. pp, percentage points. (e) Absolute deviations of observed and actual glycoform abundances from simulated abundances based on released N-glycan data. In each batch, those five glycoforms for which correction leads to the largest decrease in deviation are highlighted (thick line: most pronounced decrease). Point areas are proportional to observed/actual glycoform abundance. Error bars represent (propagated) 95% confidence intervals from five technical replicates. RMSD, root-mean-square deviation. From ref (356). CC BY 4.0.

