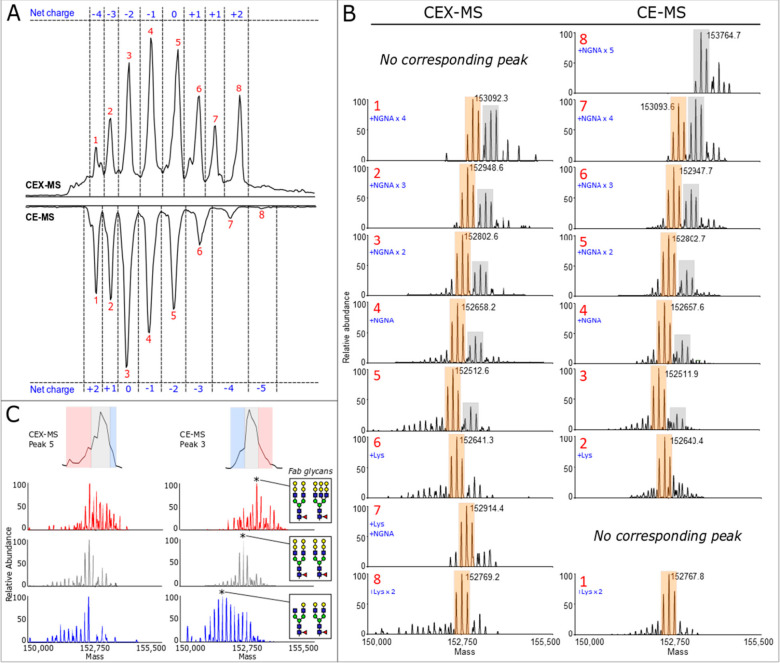
Figure 21.
Comparison between cation-exchange chromatography MS (CEX-MS) and capillary electrophoresis MS (CE-MS) in the analysis of cetuximab charge variants. (A) Cetuximab chromatogram and electropherogram, with peaks annotated in red and the corresponding net charges in blue. (B) Deconvoluted native mass spectra corresponding to the peaks in (A). Spectra from the two separation approaches containing the same charge variant species are aligned horizontally. Modifications that cause differences in the net charge are indicated in blue, whereas only the most probable combination of modifications is given. The most abundant species corresponding to biantennary Fab glycan pairs are shown in orange, whereas the most abundant forms carrying triantennary Fab glycans are labeled in gray. (C) Deconvoluted spectra of the peak front, center, and tail for peaks 5 and 3 of the CEX and CE separations, respectively. Associated spectra are aligned horizontally and are shown in the same color. Reproduced from ref (369). Copyright 2020 American Chemical Society.

