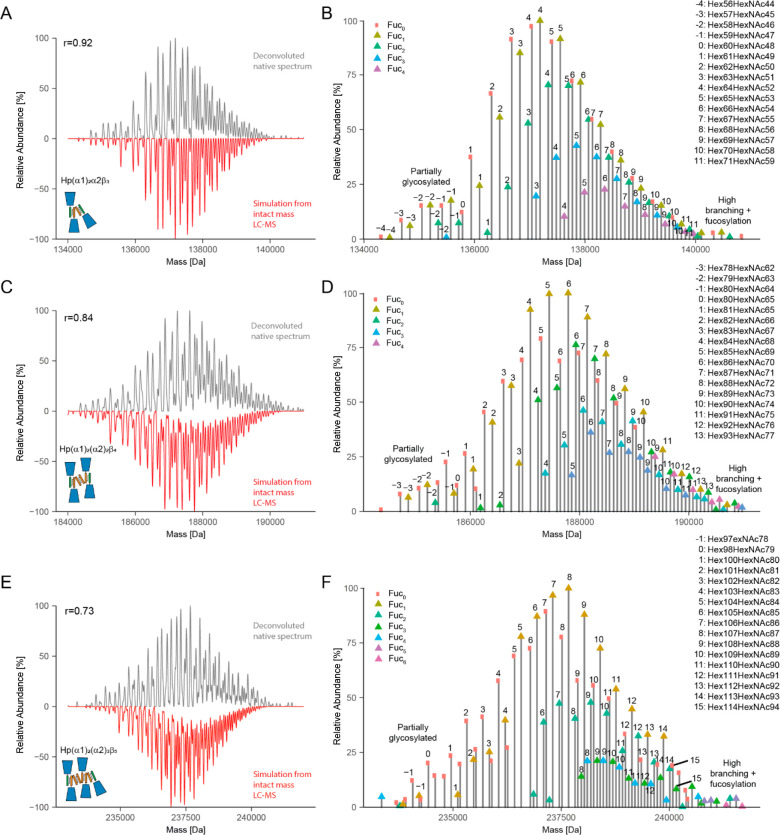
Figure 26.
Comparison of deconvoluted high-resolution native mass spectra with simulated mass spectra reconstructed from intact-mass hydrophilic interaction chromatography (HILIC) LC-MS data. (A, C, E) Mirror plots for Hp 2-1 multimers: (A) (α1)2α2β3 trimer, (C) (α1)2(α2)2β4 tetramer, and (E) (α1)2(α2)3β5 pentamer. The zero-charged deconvoluted native MS spectrum is depicted at the top and the in silico-reconstructed spectrum at the bottom. The Pearson correlation coefficient (r) for each pair of native and in silico-reconstructed spectra is given in the top left corner of each panel, and a schematic drawing of each Hp 2-1 multimer is shown in the bottom left corner of each panel. (B, D, F) Annotation of peaks detected in the native deconvoluted MS spectra for the (B) trimer, (D) tetramer, and (F) pentamer of Hp 2-1. From ref (402). CC BY-NC-ND 4.0.

