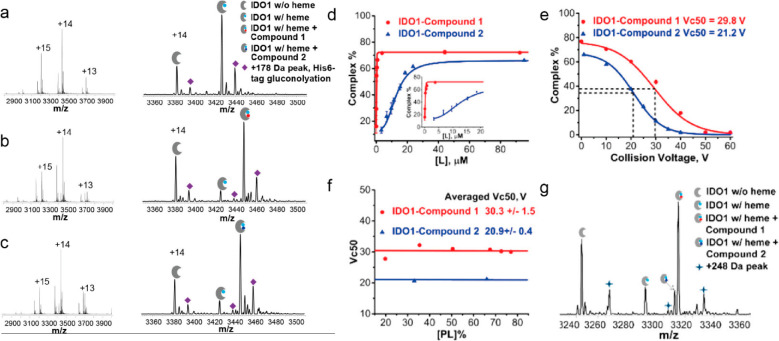
Figure 28.
Automated screening of protein–ligand interactions using a compound library and native SEC-MS. (a–c) Native mass spectra of the enzyme indoleamine-pyrrole 2,3-dioxygenase (IDO1) alone, IDO1 with compound 1, and IDO1 with compound 2, respectively. The left panels show the charge-state distributions, and the right panels focus on the enlargements of the +14 charge state for identification. For all of the spectra shown, the concentration of IDO1 was 5 μM (2 μM for IDO1 w/heme), whereas the concentration of compound 1 was 3.5 μM in (b) and that of compound 2 was 10 μM in (c). (d) Saturation curves from titration experiments. The concentration of the IDO1 sample was 13 μM (9 μM for IDO1 w/heme). The concentrations of compounds 1 and 2 ranged from 0.5 to 100 μM. (e) In-source dissociation profiles for the IDO1–compound 1 and IDO1–compound 2 complexes. Dashed lines indicate the corresponding Vc50 values. The concentration of the IDO1 sample was 12 μM, and the concentrations of compounds 1 and 2 were 89 μM. (f) Plot of Vc50 against initial complex percentage at different compound 1/compound 2 to IDO1 ratios. (g) Competition experiment for evaluation of relative binding affinities. IDO1 (total 13 μM, IDO1 w/heme 9 μM) was incubated with compounds 1 and 2 (each at 10 μM). Each precursor experiences a different lab-frame energy based on its charge state. All of the data points in (a) and (b) were replicated three times, with error bars shown on the graph. Adapted from ref (456). Copyright 2018 American Chemical Society.

