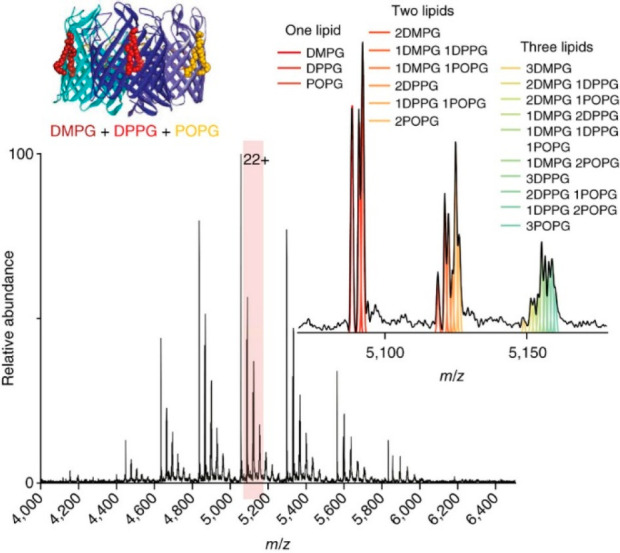
Figure 29.

Native MS spectrum (main panel) of trimeric OmpF bound to an equimolar ratio of DMPG, DPPG, and POPG lipids (cartoon inset). The 22+ charge state is shown in an expanded view (right), with peaks showing up to three bound lipids. Theoretical distributions corresponding to different combinations of lipids are shown by colored lines and correlate with the spectrum. Reproduced with permission from ref (21). Copyright 2016 Nature Publishing Group.
