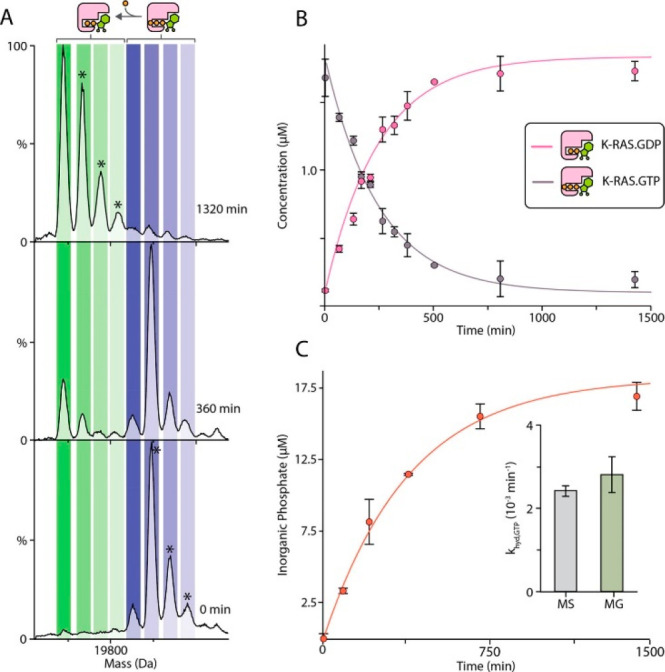
Figure 30.

Determination of the guanosine triphosphate (GTP) hydrolysis rate (khyd,GTP) for K-RAS. (A) Representative native mass spectra recorded at different time points for K-RAS (2 μM) loaded with GTP incubated at 25 °C. The abundance of K-RAS bound to guanosine diphosphate (GDP) increases as GTP is hydrolyzed. Asterisks denote species with bound sodium or magnesium adducts. (B) The concentration of K-RAS bound to GDP and GTP was determined from deconvolution of the native MS data (dots) and fitted to a first-order rate constant model (solid lines). (C) Plot of inorganic phosphate concentration determined for K-RAS·GTP using a malachite green (MG) assay. The inset shows the similar rate constant values determined by native MS and the MG assay. Reproduced from ref (469). Copyright 2019 American Chemical Society.
