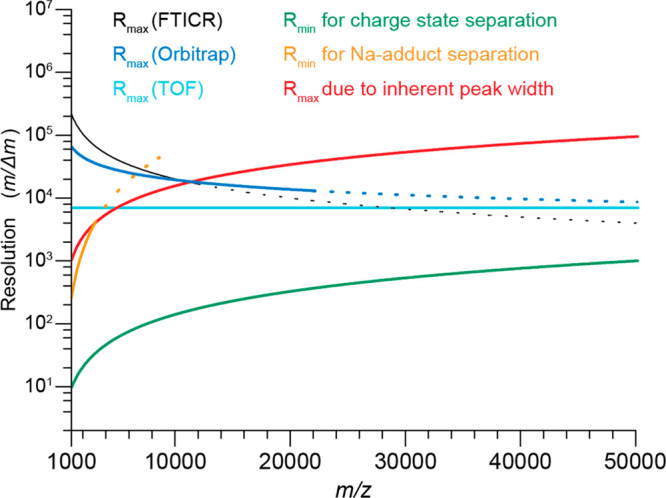
Figure 4.

Theoretical and experimental mass resolutions (m/Δm) in the m/z range from 1000 to 50 000 Th for the common mass analyzers used in native MS. Shown are plots of R vs m/z for the three mass analyzers (FT-ICR, Orbitrap, and ToF) based on their respective Rmax values reported at m/z = 5000–6000 Th (FTICR, 40 000; Orbitrap; 25 000; ToF, 7000) and the theoretically achievable relations between analyzer mass resolution and m/z (FT-ICR (black line), R ∼ z/m; Orbitrap (blue line), R ∼ (z/m)0.5; ToF (cyan line), R = constant). Dotted lines in the FT-ICR and Orbitrap graphs represent theoretical values for m/z ranges that were not accessible with these mass analyzers at the time of the publication. Reproduced from ref (32). Copyright 2014 American Society for Mass Spectrometry.
