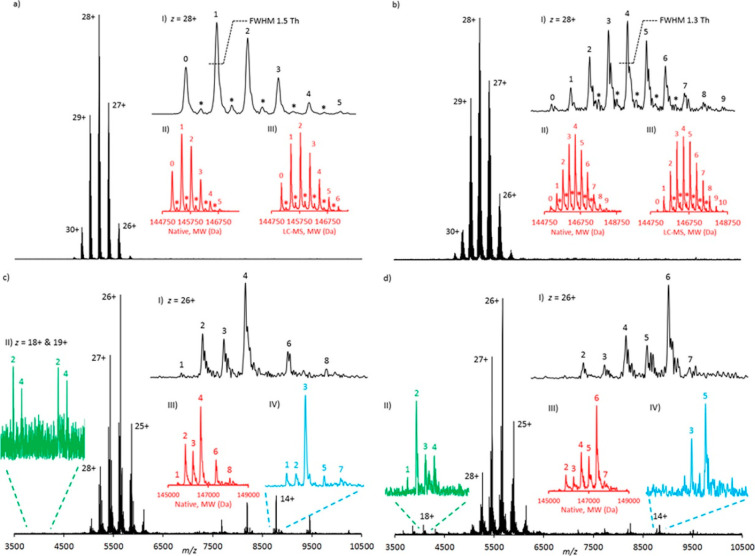
Figure 5.
High-resolution native MS analyses of antibody–drug conjugates using a 15 T FT-ICR instrument. Shown are the native MS spectra of (a) 5 equiv (biotin) lysine conjugate, (b) 10 equiv (biotin) lysine conjugate, (c) 5 equiv tris(2-carboxyethyl)phosphine (TCEP) and 10 equiv (biotin) cysteine conjugate, and (d) 10 equiv TCEP and 10 equiv (biotin) cysteine conjugate. Drug-to-antibody ratio (DAR) values are annotated on selected charge states and all of the deconvoluted spectra. Asterisks (*) represent a +162 Da glycation mass increase. Data are displayed in magnitude mode using a symmetric Hann apodization function. The annotated DAR values in insets III and IV of (c) and (d) are consistent with the numbers of biotin moieties covalently attached to the specific species and not the full intact initial monoclonal antibody conjugate molecule. Peak widths at half-height for z = 28+ are annotated. The peak widths at half-height for the equivalent deconvoluted data range from 39.2 to 41.1 Th. Reproduced from ref (108). Copyright 2017 American Chemical Society.

