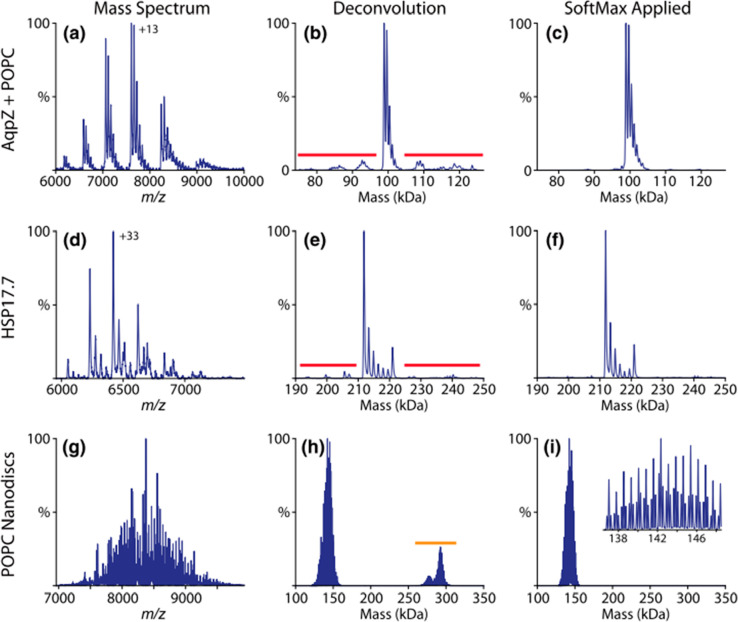
Figure 6.
Spectral deconvolution of native MS spectra using UniDec software. The native mass spectra of AqpZ with bound POPC (a) and HSP17.7 (d) show satellite artifacts (red) when deconvolved (b, e) that are removed by addition of the SoftMax function (c, f). POPC nanodiscs with mixed heavy and light belts (g) show harmonic artifacts (orange) after deconvolution (h) that are removed by the SoftMax function (i). The triplet peaks from the mixed belts are preserved by the SoftMax function, as shown in the inset. Reproduced from ref (164). Copyright 2019 American Society for Mass Spectrometry.

