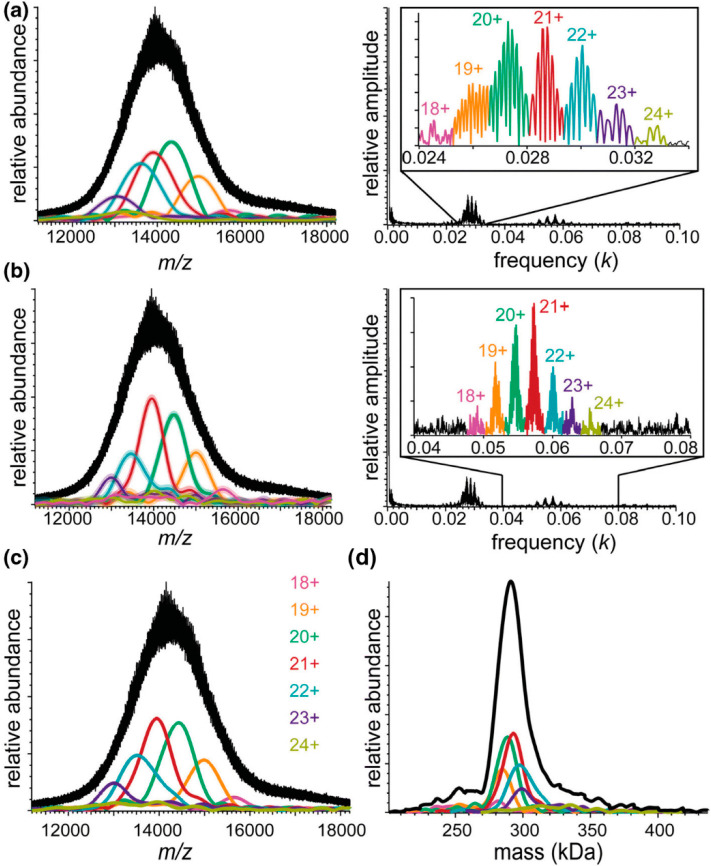
Figure 8.
Native mass spectra of DPPC-MSP1E3D1 nanodiscs acquired on a Q-ToF mass analyzer and corresponding Fourier spectra for (a) the fundamentals and (b) the second harmonics. Inverse Fourier transforms of the charge-state-specific peaks in Fourier spectra (insets) are shown as overlaid envelope functions of the same color in the mass spectra. (c) Harmonic-averaged reconstruction of envelope functions. (d) Zero-charge spectrum (black) calculated from harmonic-averaged spectra for all charge states. Reproduced from ref (169). Copyright 2018 American Society for Mass Spectrometry.

