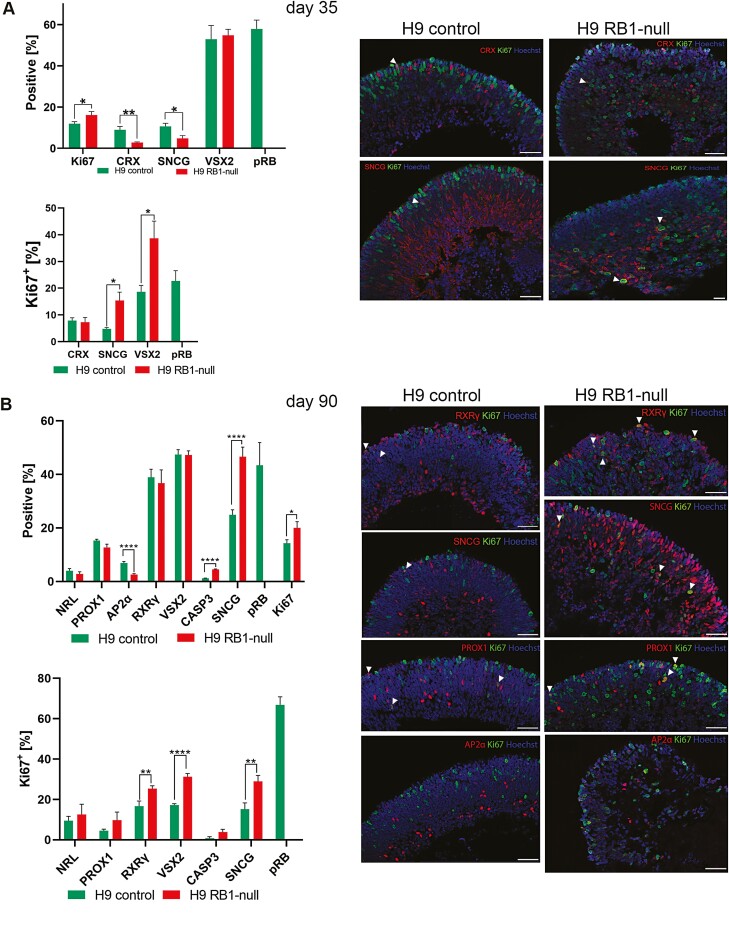
Figure 2.
Immunohistochemical analysis of RB1-null hESC retinal organoids at days 35 and 90 of differentiation. (A) Bar charts showing the retinal cell types and Ki67+ co-expressing fractions (left) and representative immunofluorescence analysis for CRX, SNCG, and Ki67, counterstained with Hoechst (right) at day 35. (B) Bar charts showing the percentage of Caspase-3+ cells (CASP3), retinal cell types and Ki67+ co-expressing fractions (left) and representative immunofluorescence analysis for RXRγ, SNCG, PROX1, AP2α, and Ki67, counterstained with Hoechst (right) at day 90. Data are presented as mean ± SEM (n = 10 sections from each biological replicate). White arrowheads point at co-localization of Ki67 with the specified retinal marker. Scale bars = 50 µm.

