Figure 6.
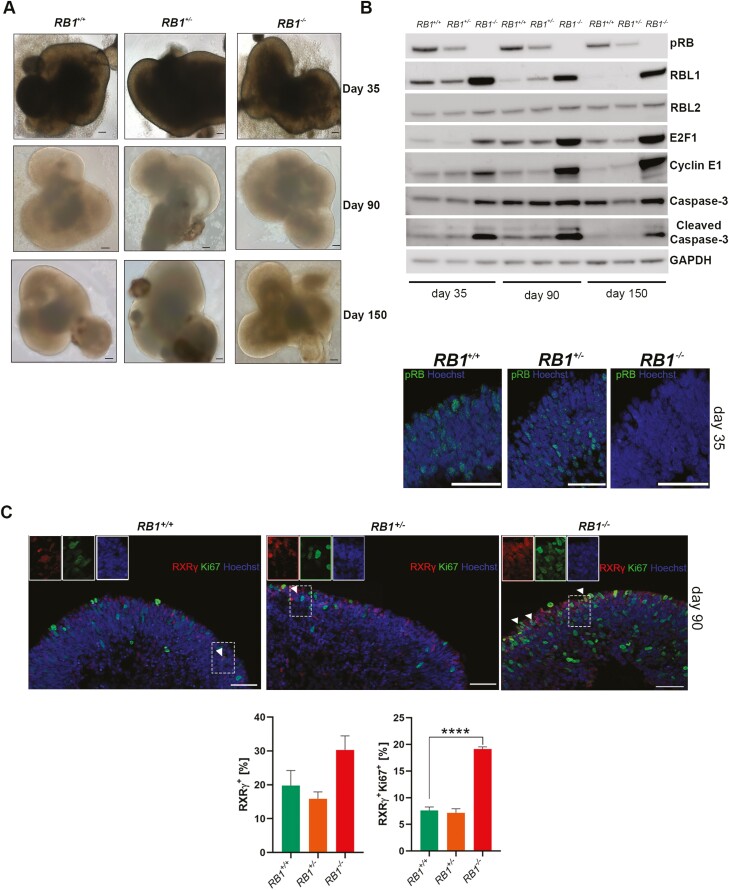
RB1 patient-specific derived retinal organoids. (A) Representative light microscopy images of retinal organoids differentiated from iPSC isogenic control, heterozygous and homozygous mutant for c.2082delC at days 35, 90, and 150, scale bar = 100 μm. (B) Western-blot analysis of pRB and related proteins steady state levels in control (RB1+/+), heterozygous (RB1+/-) and homozygous (RB1−/−) organoids at days 35, 90, and 150 of differentiation, GAPDH was used as loading control. Below, example immunostaining for pRB, counterstained with Hoechst at day 35 of differentiation, scale bar = 50 µm. (C) Representative images of immunostaining for RXRγ and Ki67, counterstained with Hoechst at day 90 of differentiation alongside graphs depicting the percentage of RXRγ expressing cells and Ki67+ co-expression fractions. Data are presented as mean ± SEM (n = 9 sections from each biological replicate), scale bar = 50 µm.

