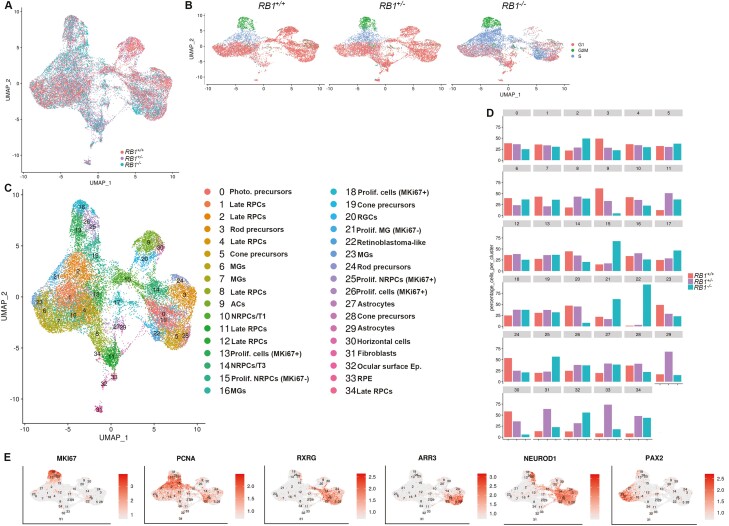
Figure 7.
Single-cell RNA-Seq of RB1 patient-specific iPSC-derived retinal organoids. UMAPs showing the cell clusters in control (RB1+/+), heterozygous (RB1+/-) and homozygous (RB1−/−) organoids (A) and cell cycle distribution (B). (C) UMAP of integrated control (RB1+/+), heterozygous (RB1+/-) and homozygous (RB1−/−) organoids with cell cluster annotations. Cluster 17 was exempted from analysis because of low read number. (D) Percentages of cells in each cell cluster of control RB1+/+, RB1+/- and RB1−/− organoids. (E) UMAPS with overlays of representative marker gene expression.

